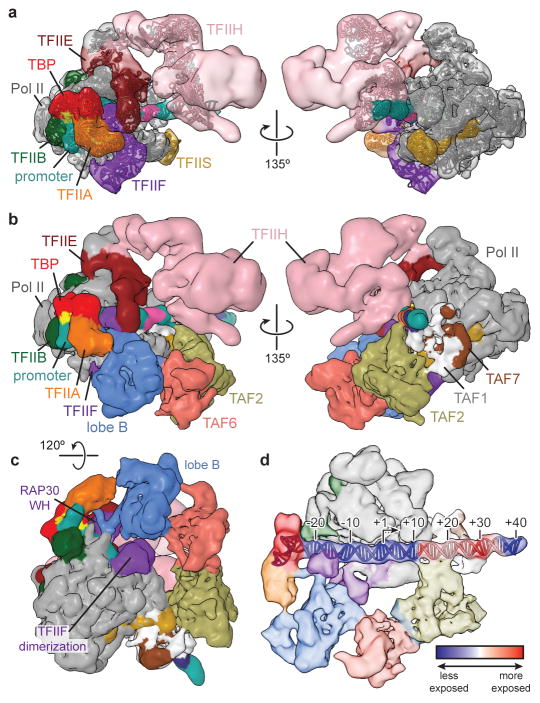
Figure 5. Model of the TFIID-based PIC.
a, Cryo-EM reconstruction of the human TAF-less PIC, with fitted atomic models. Views are similar to those in Fig. 5a in He, et al. (2013)42. b, Model of the TFIID-based PIC generated by superimposing the densities for TBP, TFIIA, and promoter DNA within the TFIID-IIA-SCP and TAF-less PIC reconstructions. For clarity, the superimposed densities from the TAF-less PIC reconstruction are hidden. c, Bottom view of the TFIID-based PIC model highlighting putative interactions between TFIID’s lobe B and TFIIF. d, Changes in protein-DNA contacts following the addition of TFIIB-Pol II-TFIIF to the TFIID-IIA-SCP complex, according to data published in Yakovchuk, et al. (2010)43. The blue to red coloring scale represents the rate constant of change in DNaseI cleavage (kobs) for each base pair following the addition of Pol II-TFIIB-TFIIF, with blue set to −10 × 10−3 s−1, corresponding to regions that become more protected, and red set to +10 × 10−3 s−1, corresponding to regions that become more exposed.

