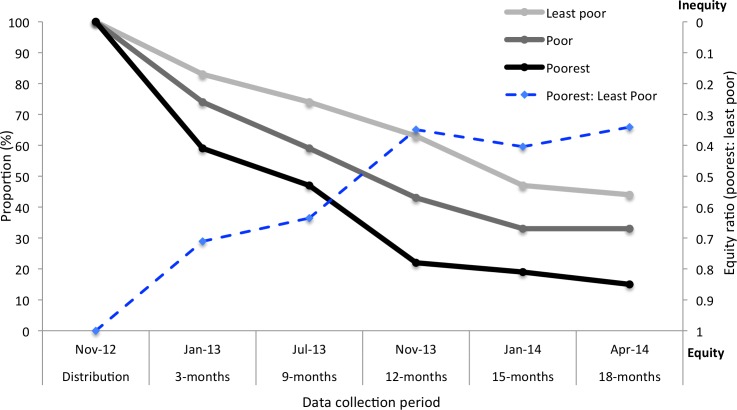
Fig 4. Proportion of Batwa households by wealth tertile reporting ownership of a LLIN post-distribution and the equity ratio in ownership between the poorest and least poor households in 10 Batwa communities in Kanungu, over a year and a half period.
The Y-axis for the equity ratio is inverted with increasing inequity towards a value of zero (top) and decreasing inequity (equity) towards a value of one (bottom). The equity ratio was calculated with the poorest households as the numerator and the least poor households as the denominator.

