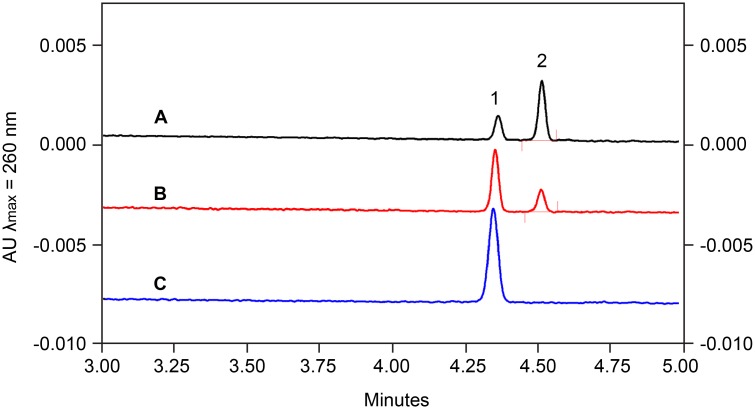
Fig 8. Tunicamycin inhibits MnaA in a concentration-dependent manner.
Representative electropherograms of the MnaA-catalyzed conversion of UDP-ManNAc to UDP-GlcNAc in the absence of tunicamycin (A), in the presence of 100 μM (B) and 200 μM tunicamycin (C). Substrate concentration is 100 μM. Peaks: 1 UDP-ManNAc; 2 UDP-GlcNAc.

