
Fig 1. Forest plot of PAS-effect calculated with the logarithmized MEP ratio between the averaged post measurements and baseline (PASlogquot).
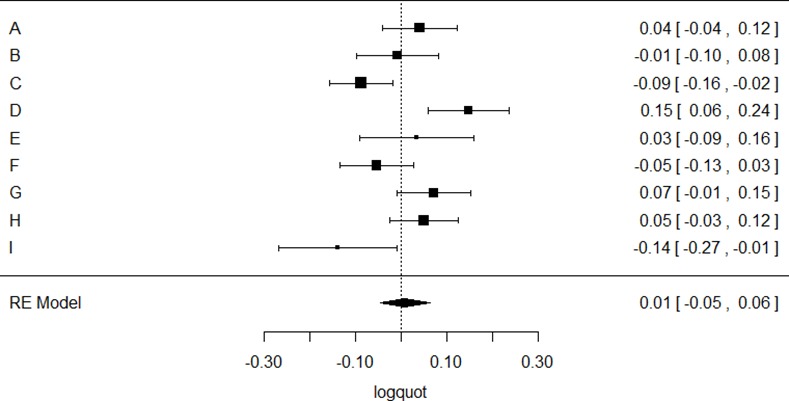
The right column lists the corresponding mean and 95% confidence interval for the individual studies, below the estimated effect across all studies is indicated.