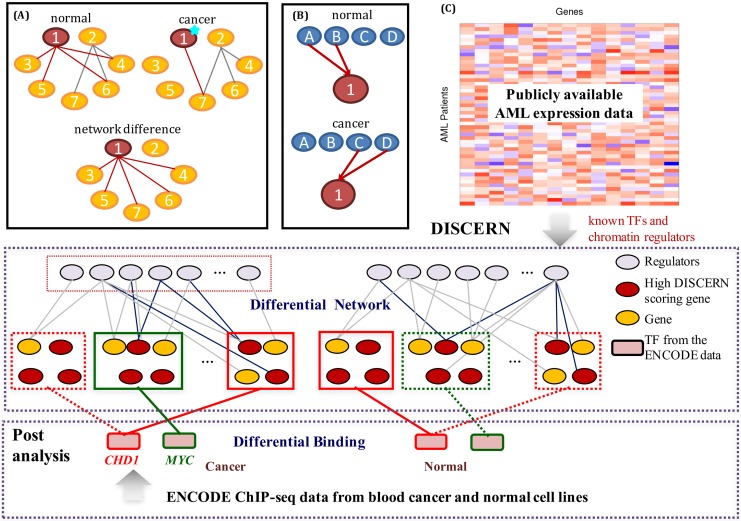
Fig 1.
(A) A simple hypothetical example that illustrates the perturbation of a network of 7 genes between disease and normal tissues. One possible cause of the perturbation is a cancer driver mutation on gene ‘1’ that alters the interactions between gene ‘1’ and genes ‘3’, ‘4’, ‘5’, and ‘6’. (B) One possible cause of network perturbation. Gene ‘1’ is regulated by different sets of genes between cancer and normal conditions. (C) The overview of our approach. DISCERN takes two expression datasets as input: an expression dataset from patients with a disease of interest and another expression dataset from normal tissues (top). DISCERN computes the network perturbation score for each gene that estimates the difference in connection between the gene and other genes between disease and normal conditions (middle). We perform various post-analyses to evaluate the DISCERN method by comparing with alternative methods, based on the importance of the high-scoring genes in the disease through a survival analysis and on how well the identified perturbed genes explain the observed epigenomic activity data (bottom).

