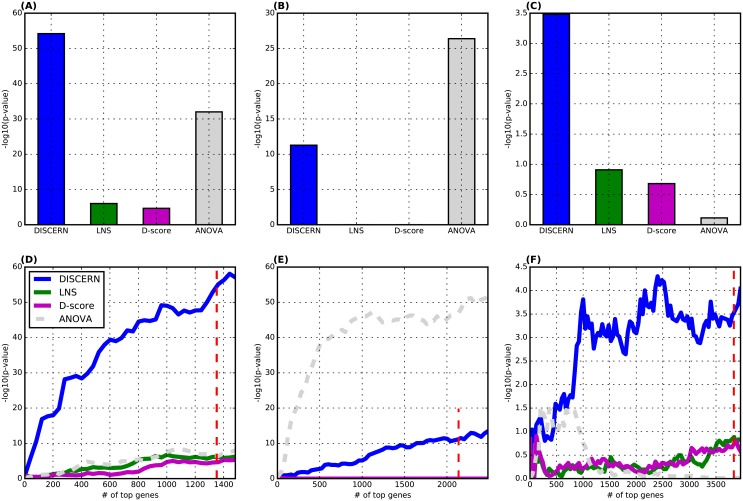
Fig 3. The significance of the enrichment for survival-associated genes in the identified perturbed genes.
We compared DISCERN with LNS and D-score based on the Fisher’s exact test p-value that measures the significance of the overlap between N top-scoring genes and survival-associated genes in each of three cancers. (A)-(C) We plotted −log10(p-value) from the Fisher’s exact test when N top-scoring genes were considered by each method in 3 datasets: (A) AML (N = 1,351), (B) BRC (N = 2,137), and (C) LUAD (N = 3,836). For ANOVA, we considered 8,993 genes (AML), 7,922 genes (BRC) and 13,344 genes (LUAD) that show significant differential expression at FDR corrected p-value < 0.05. (D)-(F) We consider up to 1,500 (AML), 2,500 (BRC), and 4,000 (LUAD) top-scoring genes in each method, to show that DISCERN is better than LNS and D-score in a range of N value. The red-colored dotted line indicates 1,351 genes (AML), 2,137 genes (BRC), and 3,836 genes (LUAD) that are identified to be significantly perturbed by DISCERN (FDR < 0.05). We compare among the 4 methods consisting of 3 methods to identify network perturbed genes (solid lines) and ANOVA for identifying differentially expressed genes (dotted line) in 3 cancer types.

