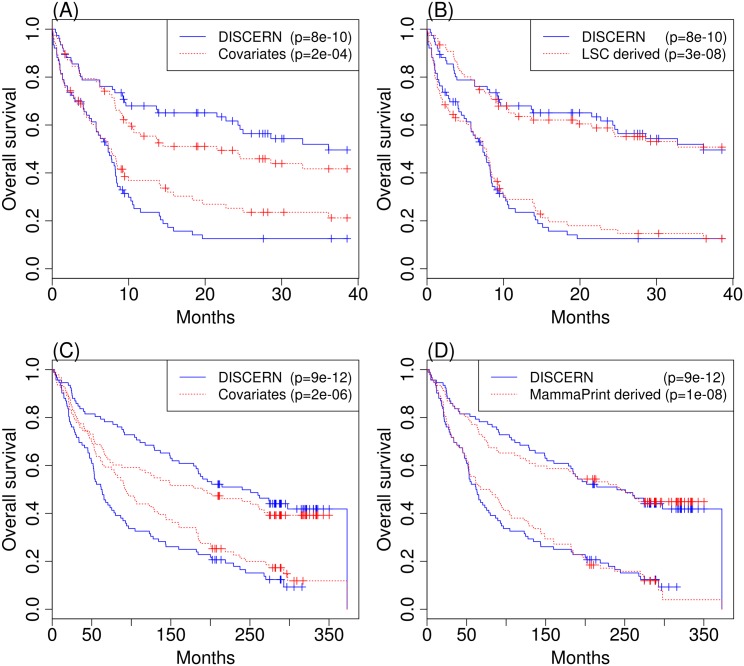
Fig 4. The Kaplan-Meier plot showing differences in the survival rate measured in AML3 (A and B) and BRC3 (C and D) between the two patient groups with equal size, created based on the predicted survival time from each prediction model.
We consider the model trained based on the top N (N = 1,351 for AML; N = 2,137 for BRC) DISCERN-scoring genes and clinical covariates (blue), and the model trained based on only clinical covariates (red) (panels A and C for AML3 and BRC3, respectively). (B) The panel shows the comparison with the model trained using genes comprising 22 genes previously known prognostic marker, called LSC [54], along with the clinical covariates (red). (D) The panel shows the comparison with the model trained using 67 genes from the MammaPrint prognostic marker (70 genes) [83] along with the clinical covariates. We used 67 genes out of 70 genes that are present in our BRC expression datasets. P-values shown in each plot are based on the logrank test (red).

