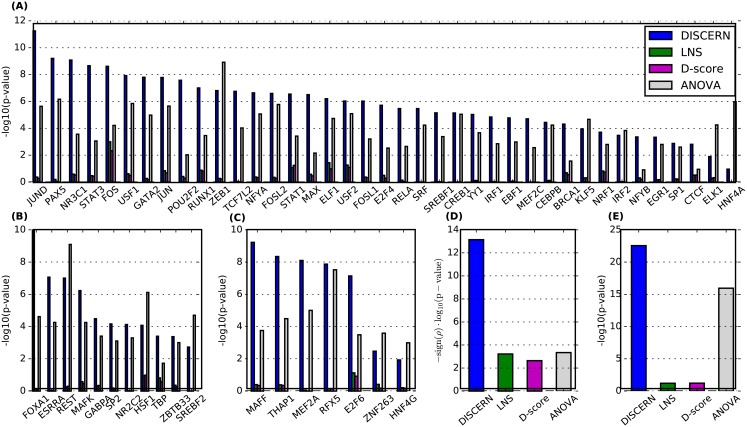
Fig 5. Kolmogorov-Smirnov test p-value measuring the significance of the difference in score between genes differentially bound by the corresponding transcription factor (TF) (x-axis) and those not differentially bound by the corresponding TF.
We performed the one-sided test with an alternative hypothesis that differentially bound genes have higher scores; thus high −log10(p-value) means that high-scoring genes tend to show differential binding. The TFs are divided into the 3 sets: (A) TFs that are known to be associated with leukemia, (B) TFs that are known to be associated with cancer, and (C) TFs that are currently not known to be associated with cancer or leukemia, based on the gene-disease annotation database Malacards [81]. (D) Comparison of the p-values for the Pearson’s correlation between the score of each gene and the proportion of differential TFs out of all TFs bound to the genes. (E) Kolmogorov-Smirnov test (one-sided as above) p-value measuring the significance of the difference in score between the genes with differential binding purely based on the DNase-seq data and those not. Here, a differentially bound gene is defined as a gene that has a DNase signal within a 150bp window around its TSS in one condition but not in the other condition.

