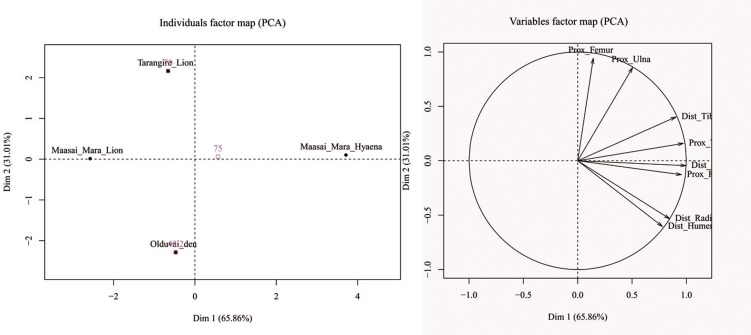
Fig 7. Variable factor map (right) and distribution of samples (left) in the two-component PCA solution analyzing furrowing patterns for lions (data from ref 79 and unpublished data from Gidna), spotted hyaenas (data from ref 80) and OCS.
The OCS assemblage shows similar amount of furrowing to the lion samples (all with negative values in the first component), but more than the lions because distal ends of humeri and radii are more furrowed (as in hyenas), hence the separation on the second component

