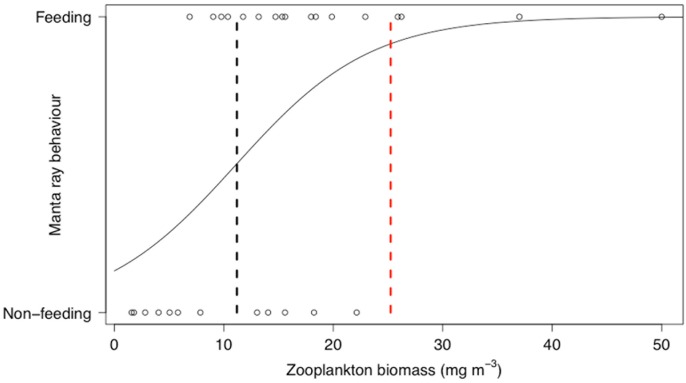
Fig 6. Critical prey density foraging threshold.
Logistic regression of reef manta ray behaviour (feeding n = 17, non-feeding n = 12) in relation to zooplankton biomass (mg m-3). The black dashed line represents the critical density threshold of zooplankton biomass required to trigger reef manta ray feeding from in-situ sampling (11.2 mg m-3) and the red dashed line represents the theoretical calculation of the density threshold (25.24 mg m-3).

