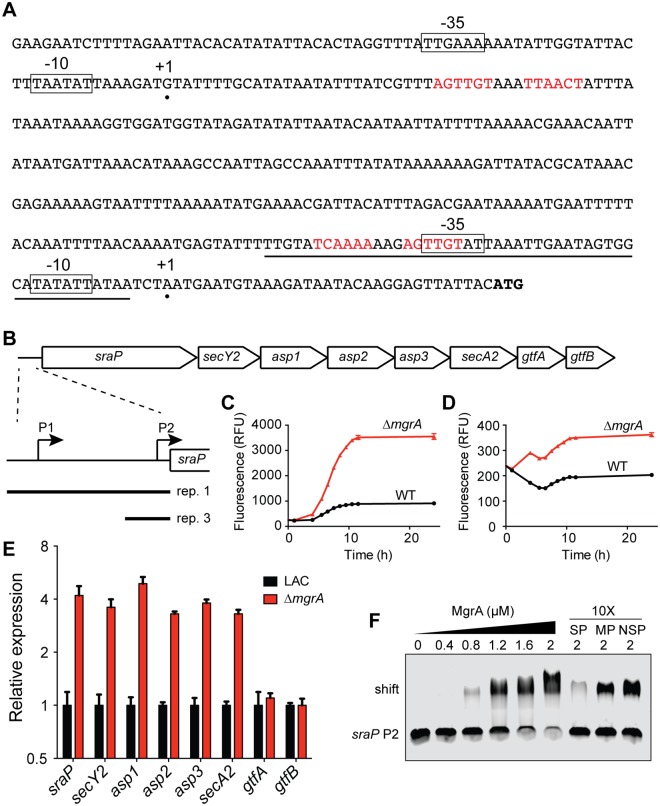
Fig 9. MgrA directly represses sraP.
(A) The sraP promoter region, showing the two putative transcription start sites (marked with black circles) determined using 5’ RACE. Potential -10 and -35 promoter elements are boxed, and possible MgrA binding sites are shown in red text. The sraP ATG start codon is indicated in bold font. The promoter probe used for EMSA experiments is underlined. (B) Schematic of the sraP gene cluster, including its dedicated secretory system (secY2, asp1-3, and secA2) as well as the putative glycosyltransferases gtfA and gtfB. Inset below shows the two promoters mapped in (A) and the regions used to make transcriptional reporter plasmids (labeled rep 1 and rep 3). (C) Expression of a GFP transcriptional fusion containing both P1 and P2 (labeled rep 1 in panel B) in LAC and the isogenic mgrA mutant. (D) Expression of transcriptional reporter 3, containing just sraP P2 driving production of GFP. (E) Expression of each gene in the sraP gene cluster in LAC and the mgrA mutant, measured by qRT-PCR. Values are averages and standard deviations of three biological replicates and are normalized to expression in LAC for each gene. (F) EMSA assessing MgrA binding to the sraP P2 promoter. Increasing concentrations of purified MgrA were incubated with the probe underlined in panel A. Unbound probe and shifted probe are indicated on the left. In the last three lanes competition with a 10-fold excess of unlabeled probes was assessed. SP, specific probe identical to the labeled probe; MP, specific probe in which the putative MgrA binding site has been mutated; NSP, non-specific probe.

