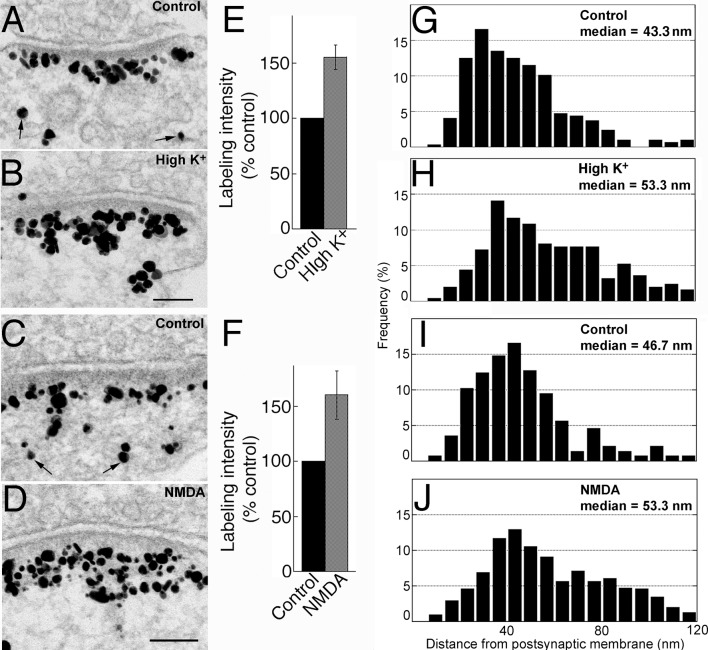
Fig 4.
(A-D) Electron micrographs of asymmetric synapses from dissociated hippocampal cultures labeled for Shank3 using ab2. Scale bars = 0.1 μm (A and B share the same scale bar, C and D share the same scale bar). Labeling intensity increased upon 2 min treatment with either high K+ (B vs. A) or NMDA (D vs. C). (E, F) Bar graphs represent combined data (mean ± SEM) from S1 and S2 Tables. (G-J) Histograms from a typical experiment depicting frequency distribution of gold particles as a function of distance from the postsynaptic membrane. Median distance of label from postsynaptic membrane increased after high K+ (H vs. G) or NMDA treatment (J vs. I), indicating preferential recruitment of Shank3 molecules to the distal layer of the PSD.

