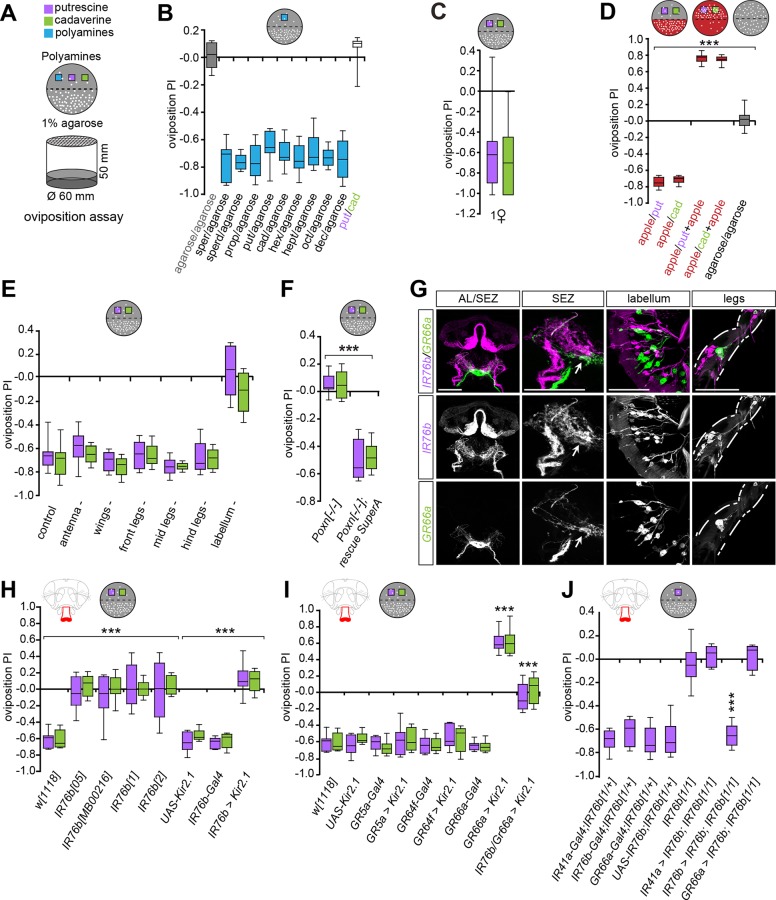
Fig 3. Oviposition site choice requires IR76b and bitter taste neurons.
(A) Schematic drawing of the oviposition assay setup (bottom) and a sample plate used to calculate the oviposition preference (top). D. melanogaster evaluates polyamine levels during egg-laying choices. The egg-laying plate halves contain 1% low melting agarose alone or agarose supplemented with a specific polyamine (purple/green boxes) in all cases with the exception of Fig 3D. (B–J) Box plots show oviposition PI of flies. y-axis value of 0 indicates indifference, while positive values indicate the degree of attraction and negative values indicate aversion. (B) Oviposition assay using plain agarose versus agarose + different polyamines at 1 mM. Box plots show median and upper/lower quartiles (n = 8, 60 ♀/trial). (C) Same assay as in B with single females showing group-independent decision-making to polyamines. (n = 30, 1 ♀ flies/trial). (D) Polyamines increase attractiveness of fruit. Oviposition PI of females for putrescine or cadaverine (grey plate) versus apple juice (red plate). While apple juice is more attractive than plain putrescine or cadaverine, apple juice supplemented with polyamine is more attractive than apple juice alone. Box plots show median and upper/lower quartiles (n = 8, 60 ♀/trial). (E) Oviposition assay (agarose versus putrescine or cadaverine) with females missing either antennae, wings, different tarsae (legs), or labellum compared to intact flies (control). Flies missing the labellum show no preference, while all other ablations had no effect on the PI. Box plots show median and upper/lower quartiles (n = 8, 60 ♀/trial). (F) Oviposition PI of loss of function Poxn females (Poxn-/-) and Poxn rescue construct (SuperA-158 (53)) for putrescine and cadaverine. Box plots show median and upper/lower quartiles (n = 8, 60 ♀/trial). (G) Expression of GR66a (GR66a-Gal4;UAS-mCD8GFP, green) and IR76b (IR76b-QF;QUAS-mtdTomato-3xHA, magenta) in the AL, SEZ, labellum and legs. GR66a and IR76b are not expressed in the same taste neurons but innervate neighboring areas in the SEZ (arrow). (H) IR76b mutants lose their preference behavior to polyamine taste (IR76b05, IR76bMB00216, IR76b1, IR76b2), IR76b-Gal4;UAS-Kir2.1, and appropriate genetic controls. Box plots show median and upper/lower quartiles (n = 8, 60 ♀/trial). (I) Two taste receptors mediate oviposition preference. Oviposition PI of silenced sweet tasting GRs (GR5a-Gal4;UAS-Kir2.1 and GR64f-Gal4;UAS-Kir2.1), and inactivated bitter tasting receptor neurons (GR66a-Gal4;UAS-Kir2.1) and appropriate controls. Silencing of bitter neurons makes polyamines attractive, while silencing sweet neurons has no effect. This attractiveness is dependent on the activity of IR76b neurons as GR66a-Gal4,IR76b-Gal4;UAS-Kir2.1 flies show no preference behavior. Box plots show median and upper/lower quartiles (n = 8, 60 ♀/trial). (J) IR76b is required to mediate the behavioral response to polyamine odor. IR76b was re-expressed in the IR76b mutant background using IR76b-Gal4, IR41a-Gal4 or GR66a-Gal4. While IR76b mutants show no preference behavior to putrescine, re-expression of IR76b in IR76b but not in IR41a or GR66a neurons fully rescued this defect. Box plots show median and upper/lower quartiles (n = 8, 60 ♀/trial). All p-values were calculated via two-way ANOVA with the Bonferroni multiple comparison posthoc test (ns > 0.05, *p ≤ 0.05, **p ≤ 0.01, ***p ≤ 0.001). In all figures, asterisks above bars refer to p-values of comparison to wild type control (first bar of the panel). Lines joining two bars or groups of bars denote all other comparisons.

