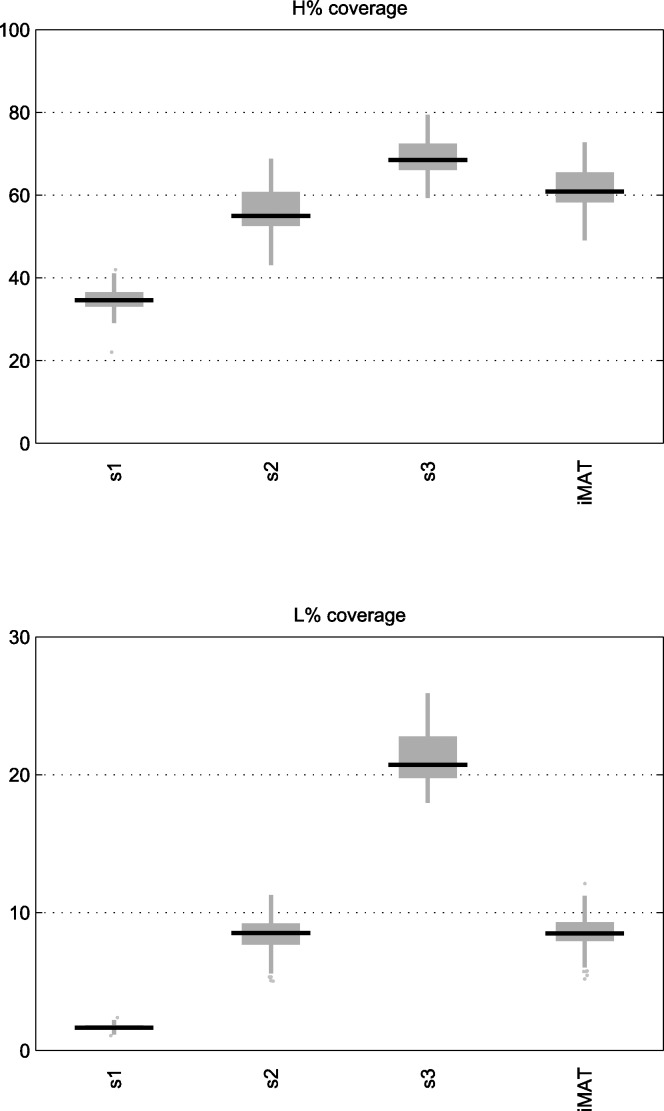
Fig 2. Boxplots of H and L reaction coverage in networks of selected cancer cell lines.
Boxplots showing the percentage of H and L reactions included in the reconstructed context-specific networks of selected cancer cell lines using our algorithm under Schema 1, 2 and 3 and iMAT. The reference network used was Recon2.

