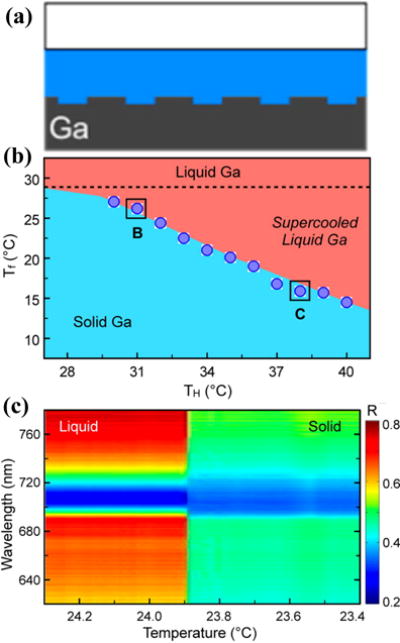
Figure 16.

(a) Cross-sectional view of a 1D Ga grating. (b) The liquid-solid phase transition of Ga with the effects of supercooling. Tf is the Ga freezing point and TH is the initial holding temperature of the liquid phase. The dotted line corresponds to the melting point of 28.0 °C. (c) Real-time reflectance spectral map at TH = 32.0 °C shows an abrupt change at 23.9 °C because of freezing of Ga. Reprinted with permission from ref. 122. Copyright (2012) American Chemical Society.
