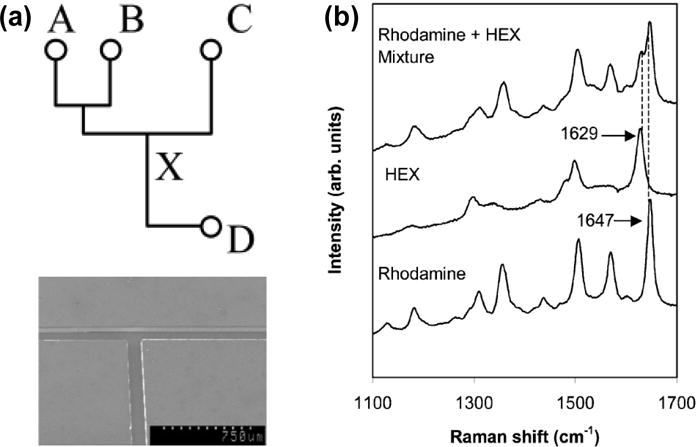
Figure 24.

(a) Schematic diagram of a SERS-microfluidic chip (upper) and SEM image of part of a PDMS microfluidic platform (below). (b) SERS spectra from rhodamine and HEX labeled oligonucleotides and from a mixture of both analytes. Reprinted with permission from ref. 206. Copyright (2004) Royal Society of Chemistry.
