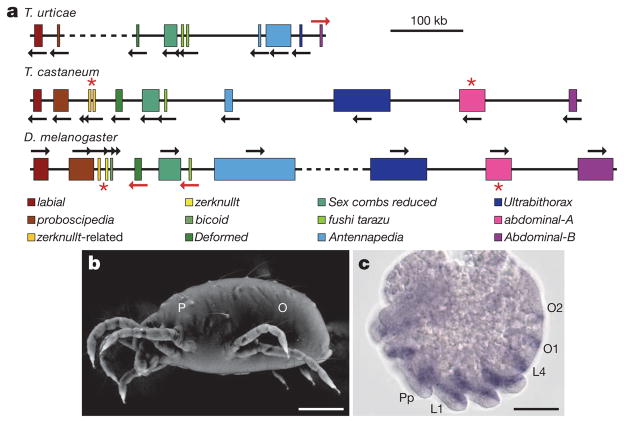
Figure 4. Comparative organization of Hox clusters and expression pattern of the T. urticae engrailed gene.
a, T. urticae, T. castaneum and D. melanogaster Hox clusters. Gene sizes and intergenic distances are shown to scale. Dashed lines represent breaks in the cluster >1 Mb. In T. urticae, fushi tarazu and Antennapedia are present in duplicate whereas abdominal-A and Hox3/zerknullt are missing (red asterisk). b, Variable pressure scanning electron microscopy (SEM) image of adult T. urticae with two main body regions indicated: P, prosoma; O, opisthosoma. c, T. urticae engrailed (en) expression pattern. en transcripts are detected in five prosomal stripes that correspond to future pedipalpal (Pp), four walking leg (L1–L4) and two opisthosomal (O1 and O2) segments. Scale bars: b, 0.125 mm; c, 40 μm.

