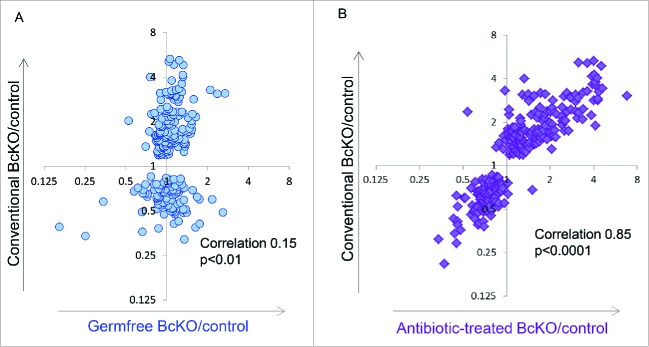
Figure 2.
Different effects of the absence of microbiota (A) and of antibiotics (B) on the B cell knockout (BcKO) gene expression phenotype in the intestine. Each dot on graphs represents ratios of gene expression between BcKO and control mice from BcKO signature (Shulzhenko & Morgun et al., 2011). Similarity between gene expression alterations induced by B cell deficiency in conventional and germ-free (A) or conventional and antibiotic-treated (B) mice is estimated using correlation analysis and represented on the graphs.

