
Figure 3.
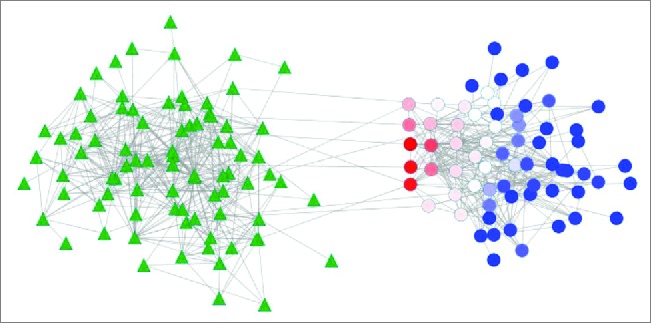
Bipartite betweenness centrality in transkingdom network. Microbial genes (circle nodes) and host genes (triangle nodes). Bi-partite betweenness centrality is calculated for each microbial gene based on the number of times it is present in the shortest paths connecting microbial genes and human genes (Dong et al., 2015). Microbial genes with high bipartite betweenness centrality (red) are more likely to be key regulators of host gene expression than genes with small values of bipartite betweenness centrality (blue).