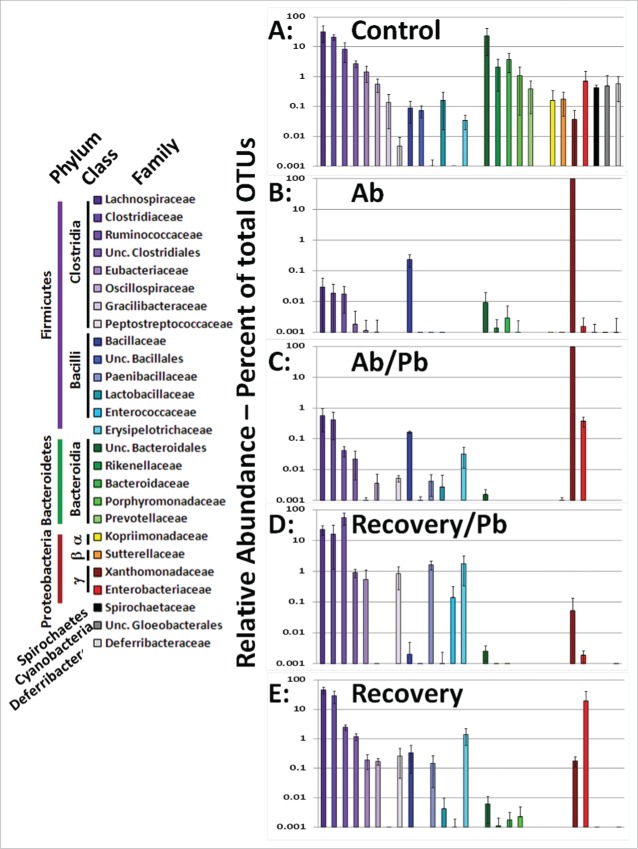
Figure 2.
Comparison of cecal/intestinal microbial community structure by rank ordering relative abundance of bacterial families following antibiotic and probiotic treatment. More than 2 million OTU tags were retrieved from sequenced DNA and relative abundance at the taxonomic family level was calculated. Family level abundance was pooled for each experimental group. Any bacterial family above 1% total in any single animal lead to inclusion in figure for all groups. Control mice did not receive antibiotics. Ab mice were on antibiotics for all 4 weeks. Ab/Pb mice were on antibiotics for 4 weeks and the last 2 weeks were supplemented with gavaged probiotics. Recovery mice were switched to regular water with or without probiotic treatment.

