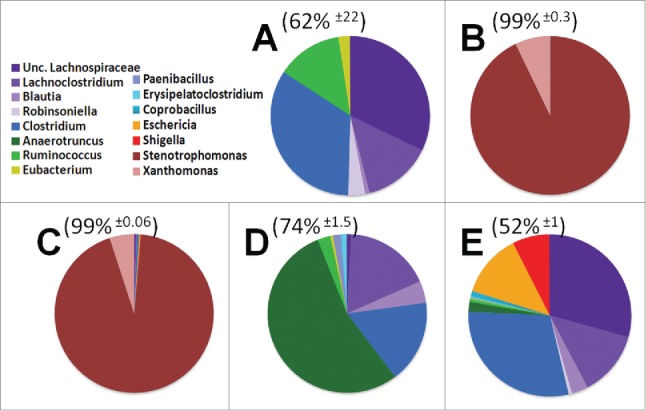
Figure 4.

Genus level diversity of dominant 15 taxa among treatment groups. The top 5 genera from each treatment group were consolidated into a pool of 15 dominant genera. These dominant genera make up the majority of OTUs from each mouse, average OTU coverage ± standard deviation displayed above pie charts. A) Control animals B) Antibiotics for 4 weeks C) Antibiotics for 4 weeks supplemented with probiotics D) Recovery from antibiotics supplemented with probiotics E) Recovery from antibiotics on regular water.
