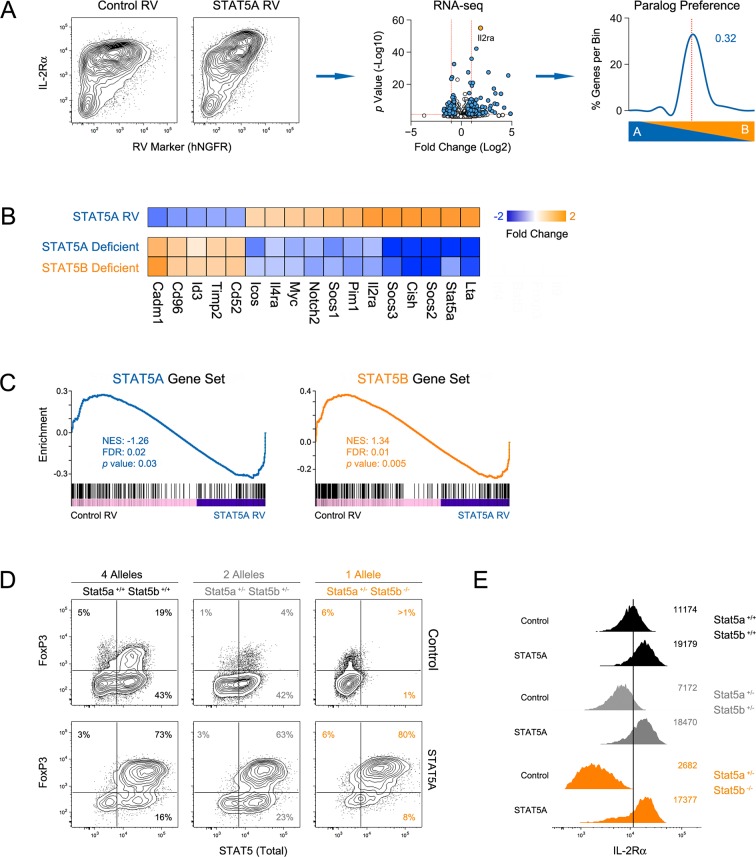
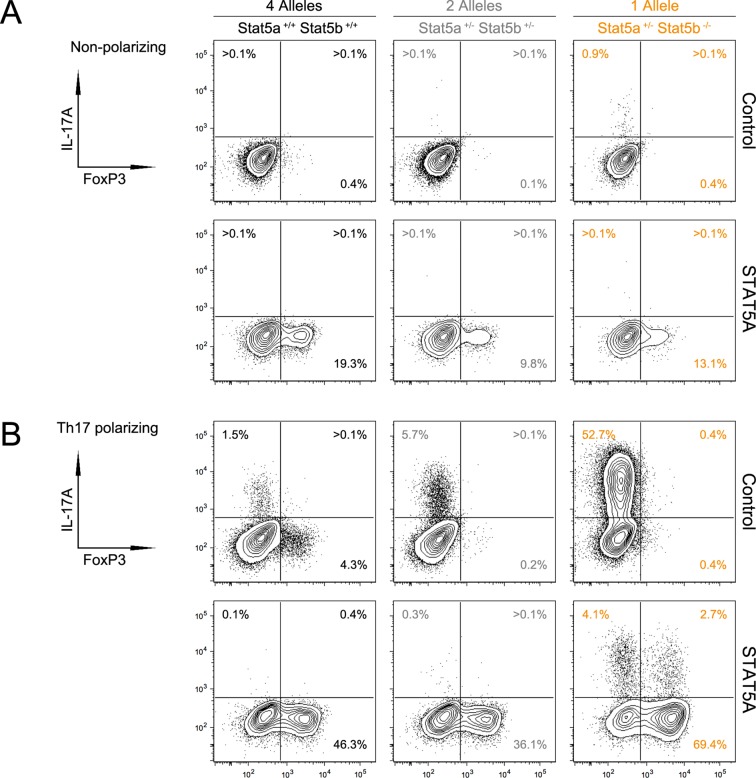
Figure 10. Paralog dose governs STAT5-driven gene transcription.
(A) CD4+ T cells from one-allele Stat5b-deficient mice were transduced with STAT5A retrovirus, then processed for RNA-seq. Contour plots (left) show correlation between the transduction marker (hNGFR) and IL-2Rα protein. Volcano plot (middle) shows log2 fold changes and variances for all transcripts relative to control retrovirus. Those exhibiting >1.5 fold change and p<0.05 are depicted in blue. Dotted red lines indicate 2 fold change and 0.05 p value. Histogram (right) shows STAT5 paralog preference for transcripts mobilized by ectopic STAT5A. Dotted red line denotes equivalence and number indicates median paralog preference. (B) Heat map shows selected transcripts in STAT5A-transduced helper T cells (top row) or IL-2 treated Stat5a- or Stat5b-deficient cells (bottom rows; from Figure 6). Data are presented as the log2 fold change relative to controls (not shown). (C) GSEA plots show enrichment of STAT5A-dependent (left) or STAT5B-dependent (right) genes within the STAT5A-RV dataset. (A–C). RNA-seq analysis is compiled from 2 biological replicates. (D) CD4+ T cells from WT, Stat5a/bhet and one-allele Stat5b-deficient mice were transduced with control (top row) or STAT5A (bottom row) retrovirus under iTreg polarizing conditions. Contour plots show total STAT5 and FOXP3 protein levels in transduced cells. (E) Histograms denote IL-2Rα protein levels on transduced cells. (D–E) Shown is one of two independent experiments.


