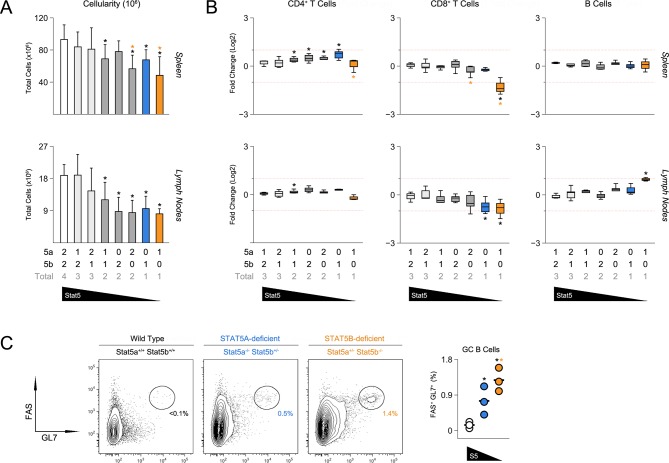
Figure 2. Impact of STAT5 paralog deficiency on B and T cells.
(A) Bar graphs show averaged cell counts for spleens (top row) and lymph nodes (bottom row). Error bars indicate standard deviation. (B) Percentages of CD4+ T cells (CD3+ CD4+ CD8α-), CD8+ T cells (CD3+ CD4- CD8α+) and B cells (CD3- B220+) were measured in spleens (top row) and LNs (bottom row). Box plots show log2 fold changes relative to wild type controls (WT=0; not shown). Dotted red lines indicate two-fold changes. (A–B) Number of Stat5a, Stat5b and total Stat5 alleles is explained in the key below each graph. Data are compiled from 5 experiments. (C) Contour plots show percentages of GL7+ Fas+ germinal center B cells in lymph nodes. Scatter plot shows percentages of LN resident GC B cells compiled from 3 experiments (3–4 mice per group). Genotypes are ordered as in Figure 1E (WT mice = white, one-allele Stat5a-deficient mice = blue, one-allele Stat5b-deficient mice = orange).

