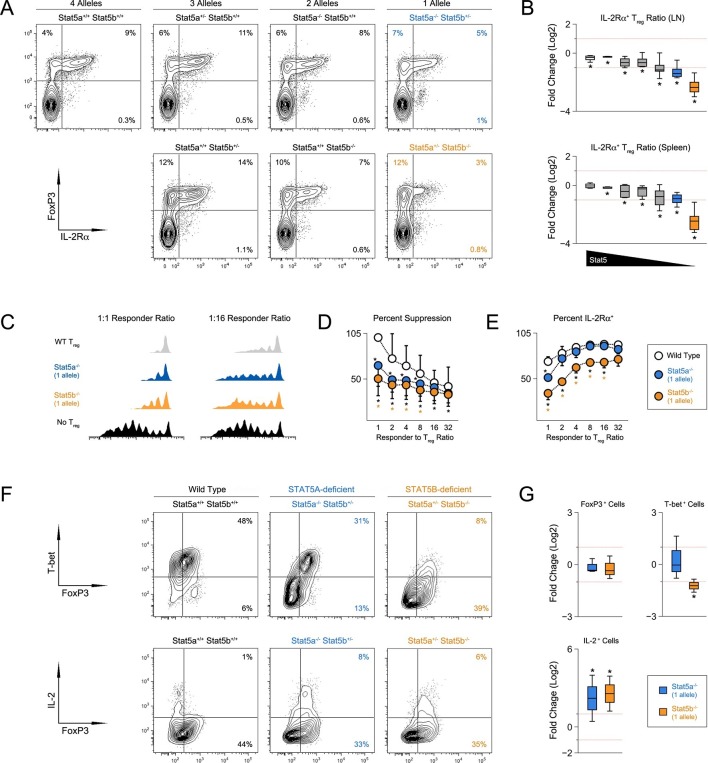
Figure 4. T regulatory cell function is impaired in Stat5b-deficient mice.
(A) Contour plots show percentages of IL-2Rα+ cells within the FOXP3+ Treg compartment in spleens of 8 week-old mice. (B) Box plots show log2 fold changes in the ratio of IL-2Rα+/IL-2Rα- Treg (WT=0; not shown). LN (top) and spleen (bottom) data are compiled from 5 experiments (4–6 mice/group) and genotypes ordered as in Figure 1D. (C) IL-2Rα+ Treg cells from WT and Stat5a- or Stat5b-deficient mice were used for in vitro suppression assays. Histograms show CFSE dilution of responder T cells. (D) Line graph shows percent suppression across a range of responder:Treg ratios. Baseline is set according to WT controls at a 1:1 ratio. Data are compiled from 3 experiments. (E) Line graph shows the percent Treg cells that remained IL-2Rα+ during in vitro suppression. (F) IL-2Rα+ Treg cells were cultured with IL-2 for 72 hr. Contour plots show the percentage of FOXP3+ Treg cells expressing TBX21 (top) or IL-2(bottom). (G) Box plots show log2 fold changes for TBX21+, FOXP3+ and IL-2+ cells relative to wild type controls (WT=0; not shown). Data are compiled from 3 experiments. Dotted red lines indicate two-fold changes.


