. 2016 Mar 21;5:e08384. doi: 10.7554/eLife.08384

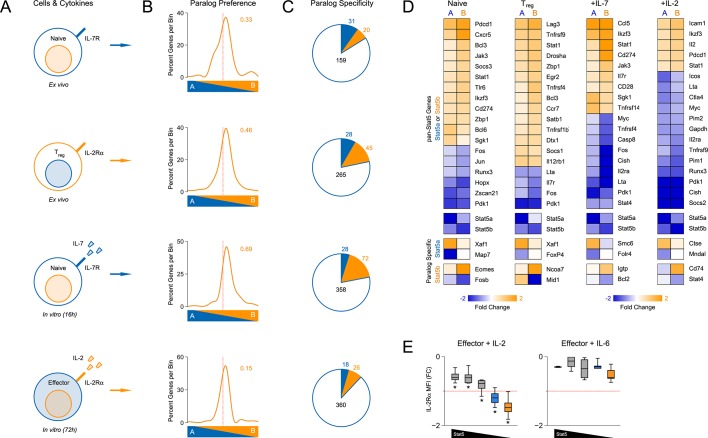
Figure 6. Redundancy and specificity of STAT5 paralogs for gene transcription.

(A) Cartoons depict the cell types and experimental conditions used for RNA-seq. (B) Histograms show STAT5 paralog preference for all STAT5-regulated transcripts. Those which were more influenced by the loss of Stat5a are positioned to the left (X<0) while those that were more influenced by the loss of Stat5b are positioned to the right (X>0). Dotted red lines denote equivalence (X=0) and numbers indicate median paralog preference. (C) Pie charts depict paralog-specific transcripts. Those impacted only in Stat5a-deficient cells are indicated in blue, those impacted only in Stat5b-deficient cells are indicated in orange and those impacted in both genotypes are indicated in black. (D) Heat maps show a selection of STAT5-regulated transcripts. Data are presented as the log2 fold change relative to WT controls (not shown). (E) IL-2Rα protein was measured in T cells treated with IL-2 (left) or IL-6 (right). Box plots show log2 fold changes for mean fluorescence intensity relative to wild type controls (WT=0; not shown). Genotypes are ordered as in Figure 1D. Dotted red lines indicate a two-fold change. (A–D) RNA-seq analyses are compiled from 2–3 biological replicates per genotype.

DOI: http://dx.doi.org/10.7554/eLife.08384.010

Figure 6.

Figure 6—figure supplement 1. Transcriptomic analysis of Stat5a- and Stat5b-deficient T cells.

Figure 6—figure supplement 1.

(A) Cartoons depict the experimental conditions used for RNA-seq. CD4+ T cells were purified from WT and one-allele Stat5a- or Stat5b-deficient mice, then transcriptomes measured either directly ex vivo or after in vitro treatment with acute STAT5 stimuli. The ex vivo set included naive cells (first row) and IL-2Rα+ Treg cells (second row), while the in vitro set included naive cells exposed to IL-7 (third row) and effector cells exposed to IL-2 (fourth row). (B) Multidimensional scaling (MDS) plots show the overall relatedness between experimental groups. Each biological replicate is represented by black (WT), blue (Stat5a-deficient) or orange (Stat5b-deficient) elements. (C) Volcano plots show fold changes and variances for all transcripts relative to WT controls. Those exhibiting >1.5 fold change and p<0.05 are highlighted. Numbers indicate the sum of transcripts that were down-regulated (upper left) or up-regulated (upper right) in Stat5a- or Stat5b-deficient cells. Dotted red lines are drawn at 2 fold changes and 0.05 p values. (D) Venn diagrams indicate the number of transcripts exhibiting >1.5 fold change and <0.05 p values only in Stat5a-deficient cells (blue), only in Stat5b-deficient cells (orange) or in both genotypes (black). (E) XY plots show log 2 fold change for STAT5-regulated genes in Stat5a-deficient (x axis) versus Stat5b-deficient (y axis) cells. Blue and orange elements represent transcripts designated as STAT5A- or STAT5B-specific, respectively. Dotted red lines are drawn at 1.5 fold changes. (A–-E) Analyses are compiled from 2 to 3 biological replicates per genotype.
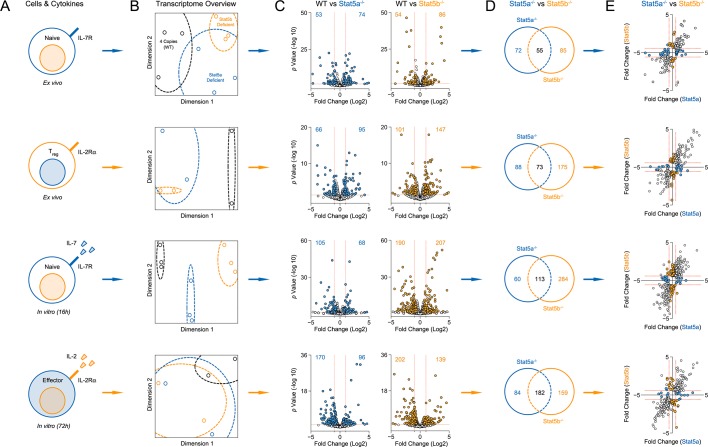
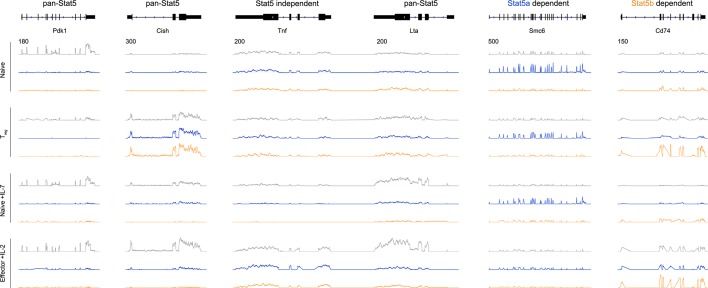
Figure 6—figure supplement 2. Transcriptomic analysis of Stat5a- and Stat5b-deficient T cells.

Figure 6—figure supplement 2.

Genome browser tracks show transcript abundance in WT (grey), Stat5a-deficient (blue) or Stat5b-deficient (orange) cells. Vertical RPKM scale varies from gene to gene (but not across experimental conditions) and is denoted by the numbers at the upper left of each column. Shown is one of 2–3 biological replicates per genotype.