. 2016 Mar 21;5:e08384. doi: 10.7554/eLife.08384

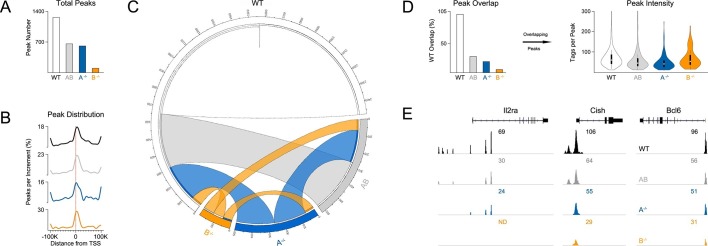
Figure 7. Influence of paralog dose on genomic distribution of STAT5.

(A) CD4+ T cells from WT, Stat5a/bhet and two-allele Stat5a- or Stat5b-deficient mice were cultured in the presence of IL-2, then processed for pan-STAT5 ChIP-seq. Bar graph shows the total number of STAT5-bound peaks in each genotype. (B) Histogram shows distribution of STAT5-bound peaks relative to transcriptional start sites (TSS). (C) Circos plot shows overlap of STAT5-bound beaks across genotypes. Connection width represents the number of overlapping peaks. Only peaks shared with WT cells are shown. Those found only in WT cells are presented as a white semi-circle at the top. (D) Bar graph shows the percentage of WT peaks detected in each genotype (WT=100%). Violin plot depicts the total number of sequenced tags (i.e. peak intensity) for peak shared with WT controls. (E) Genome browser tracks show STAT5 peaks near selected genes. Numbers indicate the maximum peak height within the interval. (A–E) Data are representative of two biological replicates.

DOI: http://dx.doi.org/10.7554/eLife.08384.013

Figure 7.

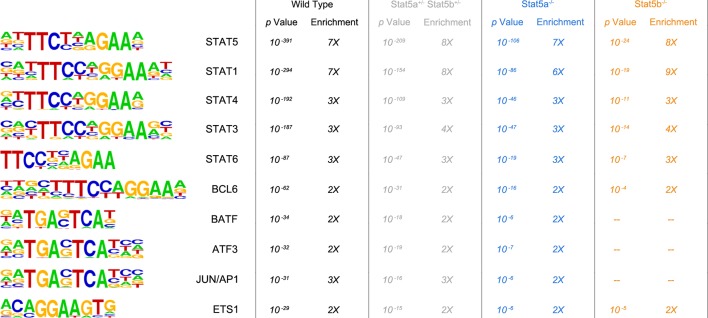
Figure 7—figure supplement 1. Transcription factor motifs associated with STAT5 binding peaks.

Figure 7—figure supplement 1.

CD4+ T cells were isolated from WT, Stat5a/bhet and two-allele Stat5a- or Stat5b-deficient mice, then cultured in the presence of IL-2 and processed for ChIP-seq. Chart shows the top ten transcription factor-binding motifs associated with STAT5 peaks in each genotype. p Values and enrichment (% STAT5 peaks with indicated motif ÷% random peaks with indicated motif) are shown for one of two biological replicates.
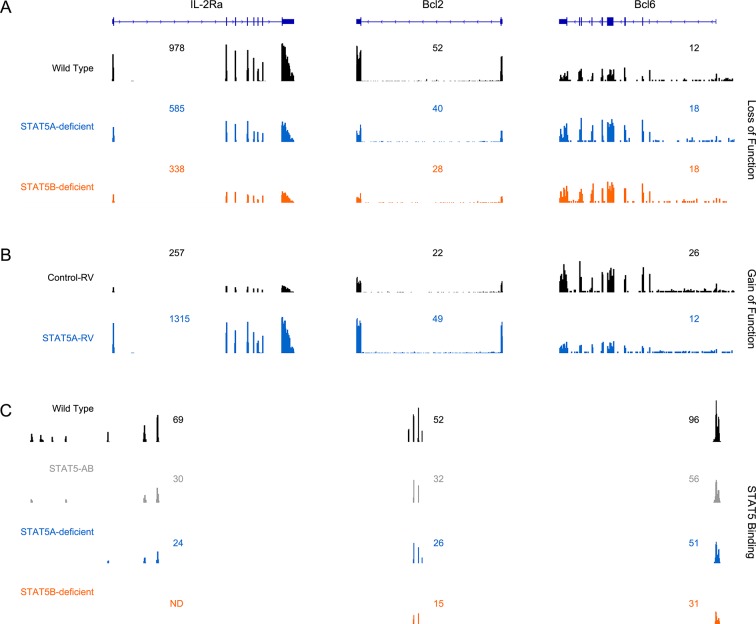
Figure 7—figure supplement 2. Correlation between STAT5 binding and transcription of Il2ra, Bcl2 and Bcl6.

Figure 7—figure supplement 2.

(A) Effector CD4+ T cells from one-allele Stat5a- or Stat5b-deficient mice were cultured in the presence of IL-2 and processed for RNA-seq. (B) Effector CD4+ T cells from one-allele Stat5b-deficient mice were transduced with control or STAT5A-expressing retrovirus and processed for RNA-seq. (C) Effector CD4+ T cells from WT, Stat5a/bhet and two-allele Stat5a- or Stat5b-deficient mice were cultured in the presence of IL-2 and processed for ChIP-seq. (A–C) Genome browser tracks show transcript abundance or STAT5 binding for selected genes. Numbers indicate either RPKM values for the most detected exon (RNA-seq) or maximum STAT5-binding peak intensity within the interval (ChIP-seq). Shown is one of two biological replicates for each genotype and/or experimental condition.