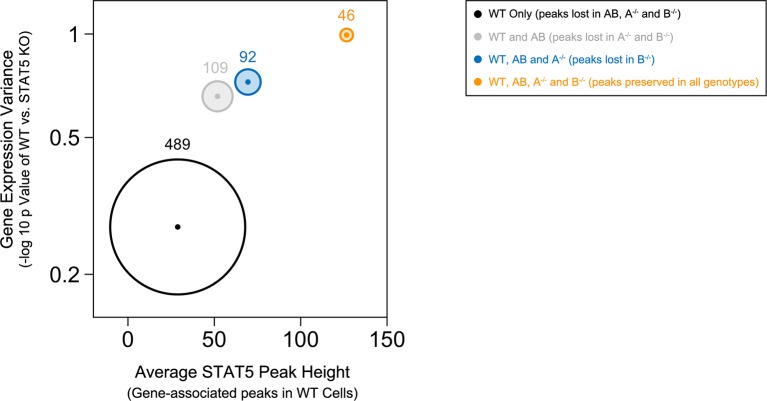
Figure 8. Preservation of high affinity targets in the absence of STAT5B.
Circle plot relates STAT5 occupancy and STAT5-dependent transcription for genes bound in: (1) only WT cells (white circle), (2) WT and Stat5a/bhet, cells (grey circle), (3) WT, Stat5a/bhet, and Stat5a-/- cells (blue circle), (4) WT, Stat5a/bhet, Stat5a-/- and Stat5b-/- cells (orange circle). STAT5 ChIP-seq peaks were assigned to genes based on proximity to transcriptional start sites (+/- 10 kb). X axis denotes the average height of gene-associated peaks in WT cells. Y axis denotes the average mRNA expression variance (-log10 p value) for the corresponding peak-associated genes. Variance is derived from the comparison WT and one-allele Stat5a- or Stat5b-deficient cells cultured in the presence of IL-2 (from Figure 6). Size of each circle represents the total number of gene-associated peaks in each group (number is shown).

