. 2016 Mar 21;5:e08384. doi: 10.7554/eLife.08384

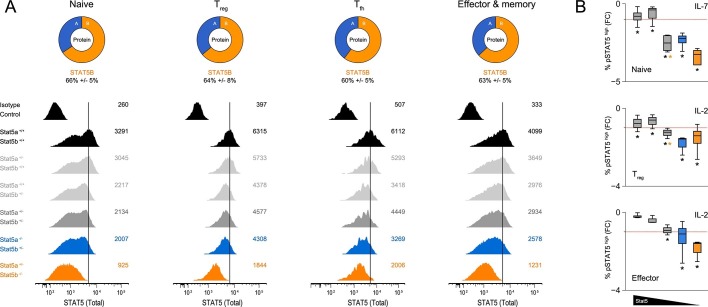
Figure 9. Relative abundance of STAT5A and STAT5B in helper T cells.

(A) Total STAT5 protein was measured in naive, Treg, Tfh and effector/memory T cells. Donut charts indicate the percentage of total STAT5 protein accounted for by each paralog. Histograms show representative flow cytometry data from one of three experiments. (B) Naive, Treg and effector/memory T cells were treated with IL-2 or IL-7 and phospho-STAT5 measured by flow cytometry. Box plots show log2 fold changes for the percentage of p-STAT5high cells relative to wild type controls (WT=0; not shown). Genotypes are ordered as in Figure 1D. Dotted red lines indicate a two-fold change (3–4 replicates/group).

DOI: http://dx.doi.org/10.7554/eLife.08384.017

Figure 9.

Figure 9—figure supplement 1. Relative abundance of STAT5A and STAT5B in helper T cells.

Figure 9—figure supplement 1.

(A) Donut charts indicate the percentage total STAT5 mRNA (top) or protein (bottom) accounted for by each paralog in ex vivo naive or Treg cells. mRNA data are compiled from 2–3 RNA-seq replicates and protein data are compiled from 3 flow cytometry replicates (B) Donut charts indicate the percentage total STAT5 mRNA accounted for by each paralog in mouse naive or Treg cells. Data were sourced from the Immunological Genome Project (top) or the EMBL-EBI Expression Atlas (bottom). (C) Donut charts indicate the percentage total STAT5 mRNA accounted for by each paralog in human naive or Treg cells. Data were sourced from the BioGPS Primary Cell Atlas.
Figure 9—figure supplement 2. Stat5a and Stat5b are transcribed from opposite DNA strands.

Figure 9—figure supplement 2.

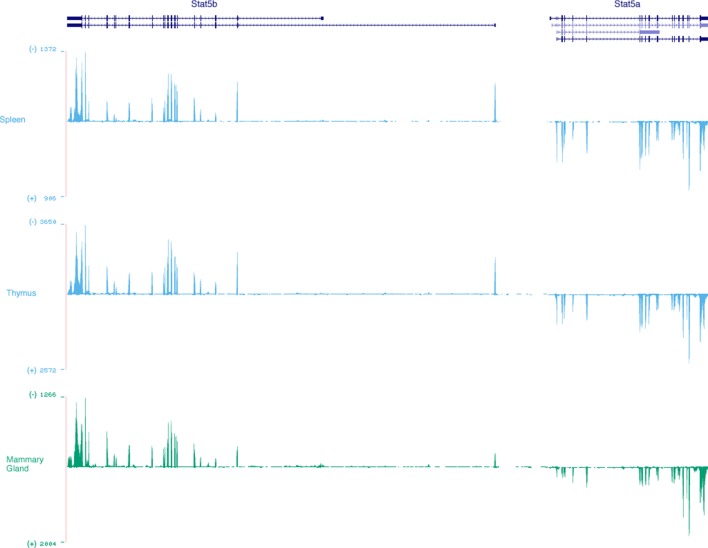
Genome browser tracks show relative abundance and DNA strand origin of Stat5a and Stat5b mRNAs within mouse spleen, thymus and mammary gland. Transcripts originating from the minus (-) strand are presented in the ascending orientation while those from the plus (+) strand are in the descending orientation. Numbers indicate RNA-seq FPKM values for the most detected exon within the interval. Data are sourced from the ENCODE consortium and one of 2 biological replicates visualized using the UCSC genome browser.
Figure 9—figure supplement 3. Putative lymphocyte-restricted enhancers within the Stat5a/b locus.

Figure 9—figure supplement 3.

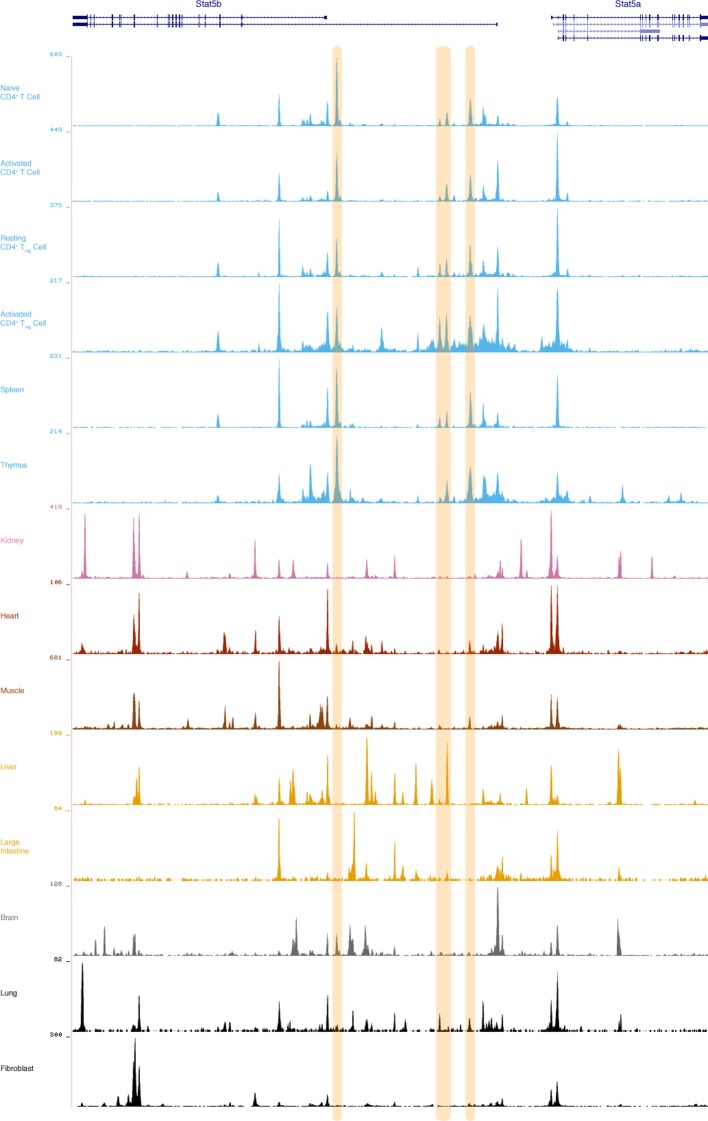
Genome browser tracks display DNAse I hypersensitivity sites (DHS) within the mouse Stat5a/b locus. Shown are data for primary CD4+ T cells (naive, activated, Treg), as well as spleen, thymus and multiple non-lymphoid tissues. 3 putative lymphoid-specific DHS sites are highlighted. Numbers indicate maximum tag count for all DHS sites within the interval. Data are sourced from the ENCODE consortium and one of 2 biological replicates visualized using the UCSC genome browser.