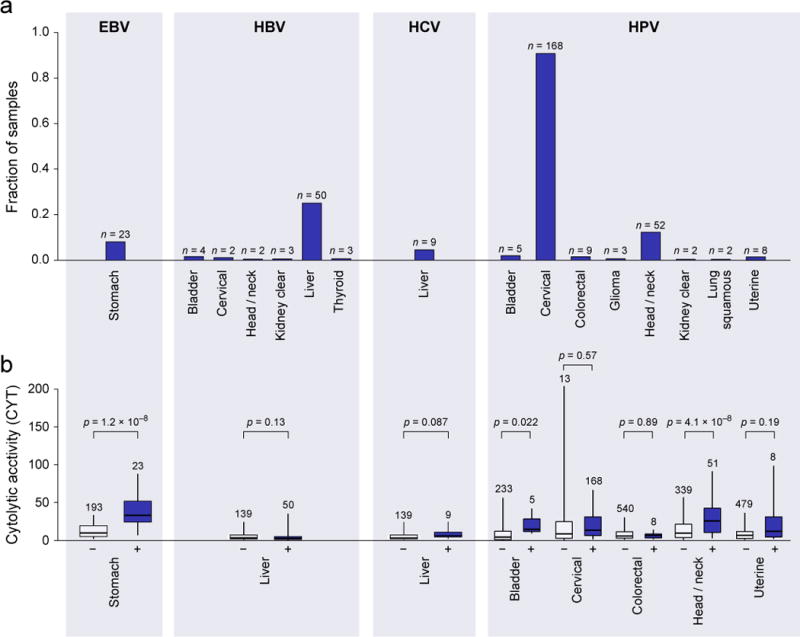
Figure 2. Viral infection is tumor-specific and associated with higher CYT in a subset of tumor types.

(A) Rates of viral infection, as defined by viral RNA-Seq read counts exceeding those observed in GTEx, for tumor types exhibiting at least one case. Isolated cases of several other viruses were also observed. (B) Distribution of CYT in tumor samples with (+) or without (−) viral infection. In tumor types affected by multiple viruses, “negative” samples include only those negative for all viruses. Box plots as in Figure 1. P-values are according to Wilcoxon rank-sum test. See also Data S2 and Table S2.
