
Figure 3. Count of predicted antigenic mutations per sample is linked with cytolytic activity and selectively depleted in certain tumor types.
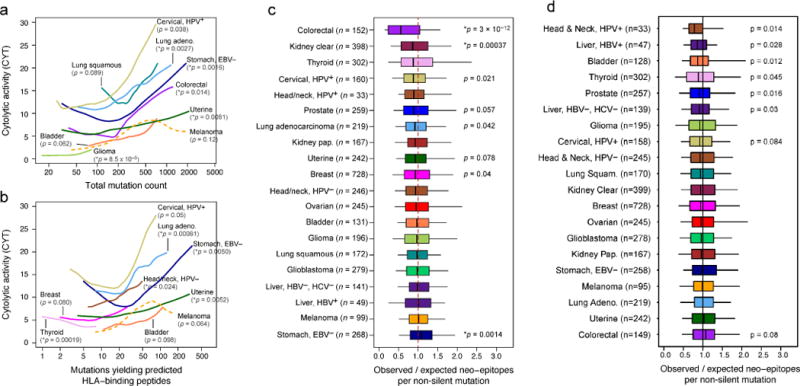
(A) Local regression curves showing significant relationships between CYT and total mutation count in eight tumor types (p<0.1, Spearman rank correlation), plus melanoma (dotted line). Curves span the 5th to 95th percentile of the mutation count variable. Colors correspond to tumor type and are the same as appear in Figure 1. (B) Analogous to (a), but based on the count of point mutations predicted to yield an antigenic neo-epitope. Potential for antigenicity was defined based on gene expression and potential to bind the corresponding patient’s imputed HLA with high affinity. (C) For each tumor, the count of point mutations predicted to generate neo-epitopes was divided by the total count of non-silent point mutations to yield Bobs/Nobs. This observed ratio was compared to an expected ratio, Bpred/Npred, estimated from the mutational spectra of the silent point mutations in the given sample using an empirical model (Methods). The ratio of the observed and predicted ratios represents the relative deviation of the neo-epitope rate from expectation. P-values reflect Wilcoxon rank-sum tests for deviation from 1. (D) Analogous to Figure 3C, but using neo-epitope prediction based on randomly re-permuted HLA genotype assignments (across patients). Asterisks denote trends significant at 10% FDR for all panels. See also Data S3, Table S3, and Table S4.