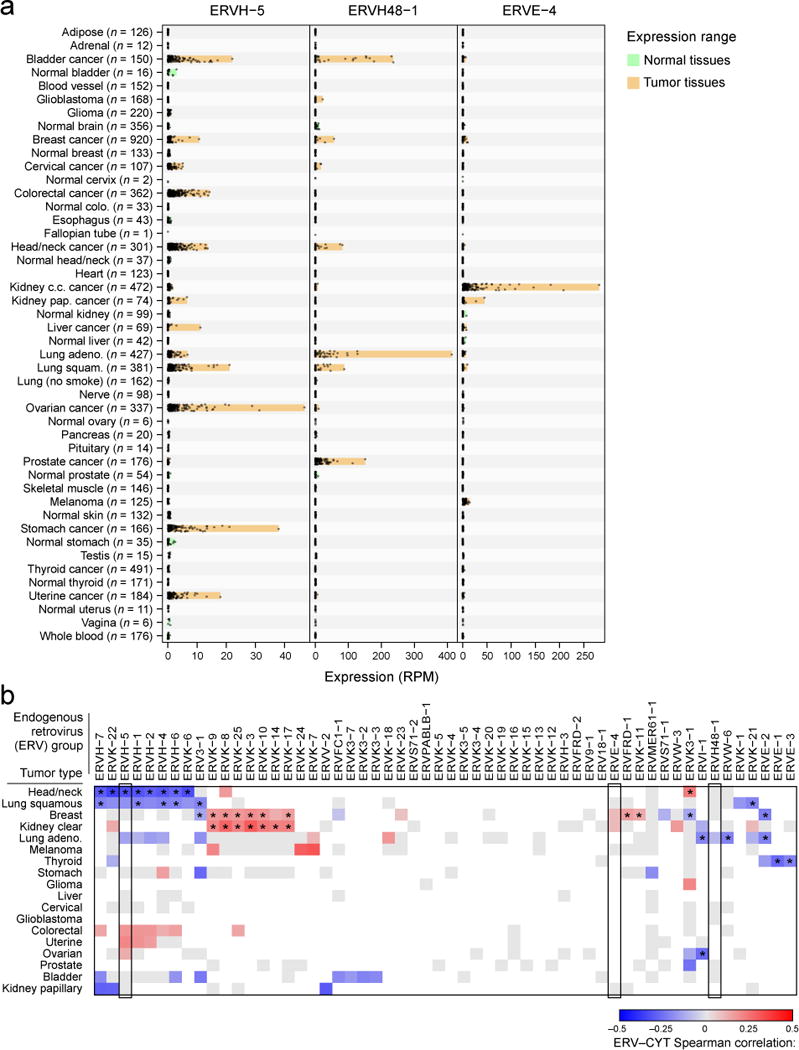
Figure 4. Endogenous retroviruses tied to local immunity.

(A) RNA-Seq-derived ERV expression in reads per million (RPM) across 18 TCGA tumor types and 27 non-tumor tissue types (from TCGA and GTEX) for three elements found to be tumor-specific. The expression ranges (minimum value to maximum value) are highlighted in orange (for tumor tissues) or green (for non-tumor tissues). (B) Spearman-rank correlations between CYT and ERV expression. Gray squares indicate non-significant association (unadjusted p>0.05) and blank squares indicate no over-expression of the given ERV in the given tumor type (expression strictly below the normal tissue maximum). Asterisks (*) denote Bonferroni-significant associations (adj. p<0.05). See also Data S4 and Table S5.
