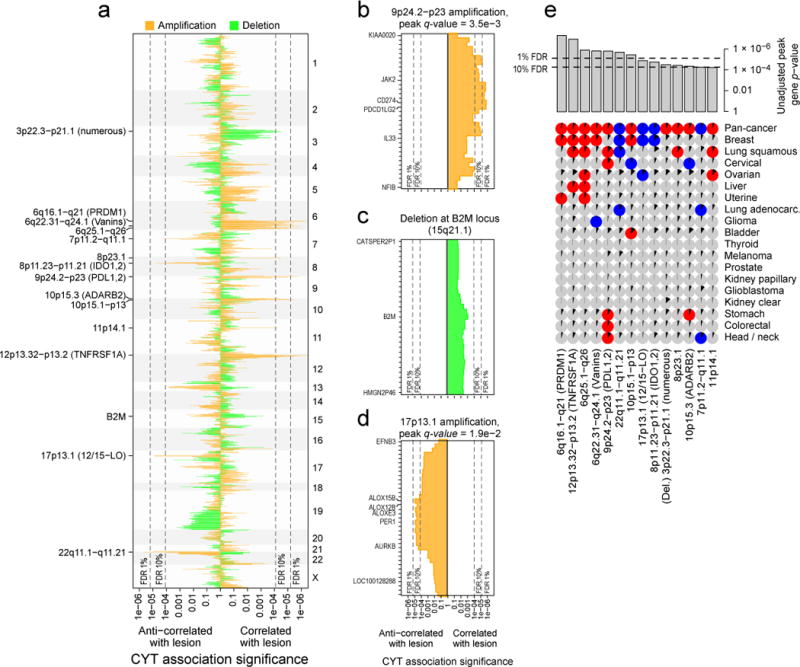
Figure 6. Amplifications and deletions are associated with cytolytic activity in tumors.

(A) The significance of association between CYT and amplification (orange) and between CYT and deletion (green) for all genic loci. Rightward lines show unadjusted p values for instances in which the lesion was positively associated with CYT, and leftward lines show unadjusted p values for instances in which the lesion was negatively associated with CYT. Dotted lines represent the significance cutoff yielding 1% and 10% FDRs (and also appear in parts B–E). Labels on the right side mark events significant at the 10% FDR, plus B2M. Potential driver genes appear in parentheses. (B) Locus zoom on the 9p24.2-p23 amplification, each bar corresponding to a single gene. Labeled genes include those with driver potential or those on the locus boundary. (C) Locus zoom on the region containing B2M, which was not genome-wide significant. (D) Locus zoom on the 17p13.1 amplification. (E) Significant associations between CNAs and CYT on the pan-cancer and cancer-specific level (as in Figure 5). Pan-cancer significance was defined at a 10% FDR, and significance for individual tumor types was defined at unadjusted p<0.05. Positive association is indicated with red circles, negative with blue circles, and non-association with gray circles. Black wedges indicate the share of samples exhibiting the event (ie. non-zero GISTIC score at the locus). Bar plot indicates unadjusted pan-cancer p-values for CNAs, sorted by significance, with dashed lines indicating thresholds yielding 1% and 10% FDRs. See also Data S6 and Table S7.
