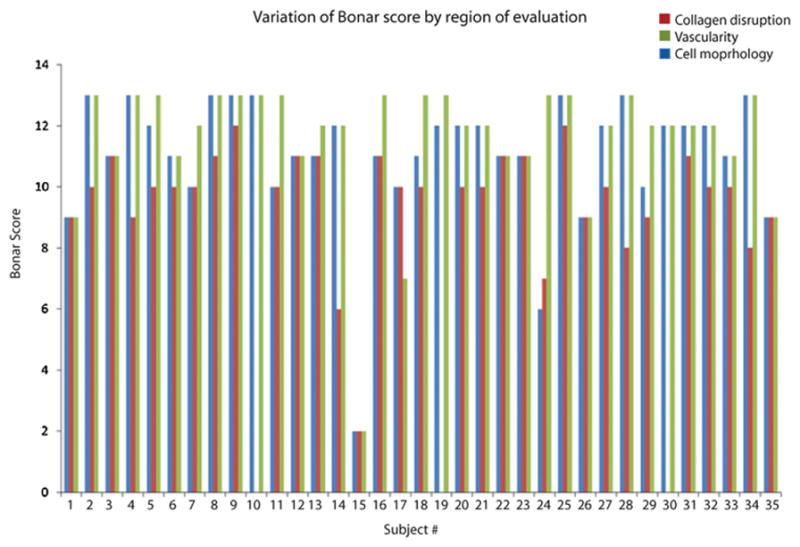
Figure 1.

Individual participant Bonar scores, by category. Evaluating the area of worst cell morphological change resulted in the highest overall Bonar score. The area of collagen disruption also resulted in high scores. The area of highest vascularity resulted in the lowest scores. In some participants the score varied markedly depending on which area was assessed, e.g. participants #12 and #13 compared to #24, #29, and #30 (which had no areas of visible vessels).
