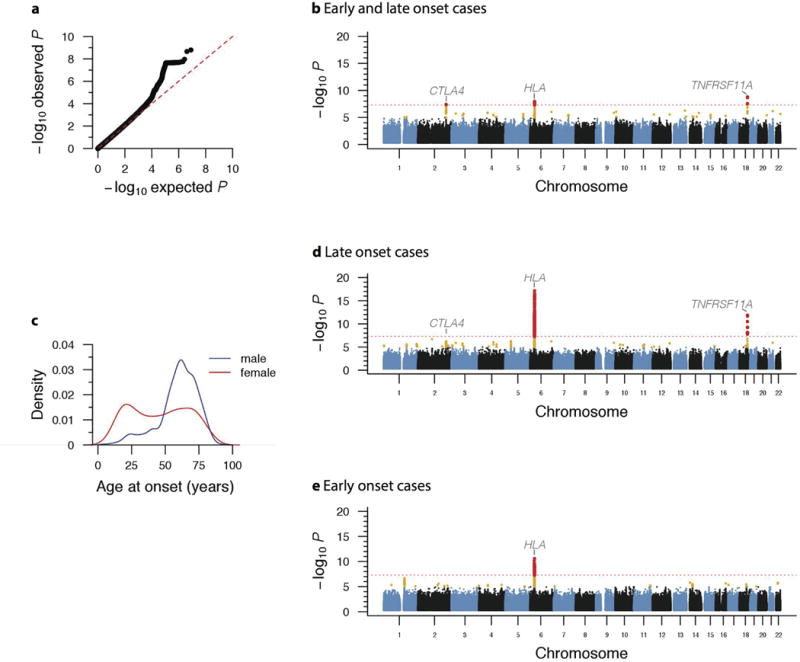
Figure 1. Myasthenia Gravis Cases and P Values From the Genome-Wide Association Study of Myasthenia Gravis.

A, Quartile-quartile plot showing the distribution of expected vs observed P values for the US discovery cohort (972 myasthenia gravis cases and 1977 control individuals; λ = 1.036). B, Manhattan plot of genome-wide association results for all myasthenia gravis cases (972 cases and 1977 control individuals). C, Density plot of myasthenia gravis cases (n = 972) showing bimodal frequency distribution with disease being more common in younger women and older men. D, Plot of genome-wide association results for late-onset myasthenia gravis cases (737 cases and 1977 control individuals). E, Plot of genome-wide association results for early-onset myasthenia gravis cases (235 cases and 1977 control individuals). CTLA4 indicates cytotoxic T-lymphocyte–associated protein 4; HLA, human leukocyte antigen; and TNFRSF11A, tumor necrosis factor receptor 4 superfamily, member 11a, NFKB activator gene. The orange horizontal line depicts the Bonferroni-adjusted significance threshold (5.0 × 10⁻⁸). Single-nucleotide polymorphisms exceeding this threshold are indicated with red dots, whereas single-nucleotide polymorphisms with a P < 10−4 and >5.0 × 10⁻⁸ are indicated with yellow dots.
