
Figure 2. Regional Association Plots Across Loci Identified by the Genome-Wide Association Study of Myasthenia Gravis.
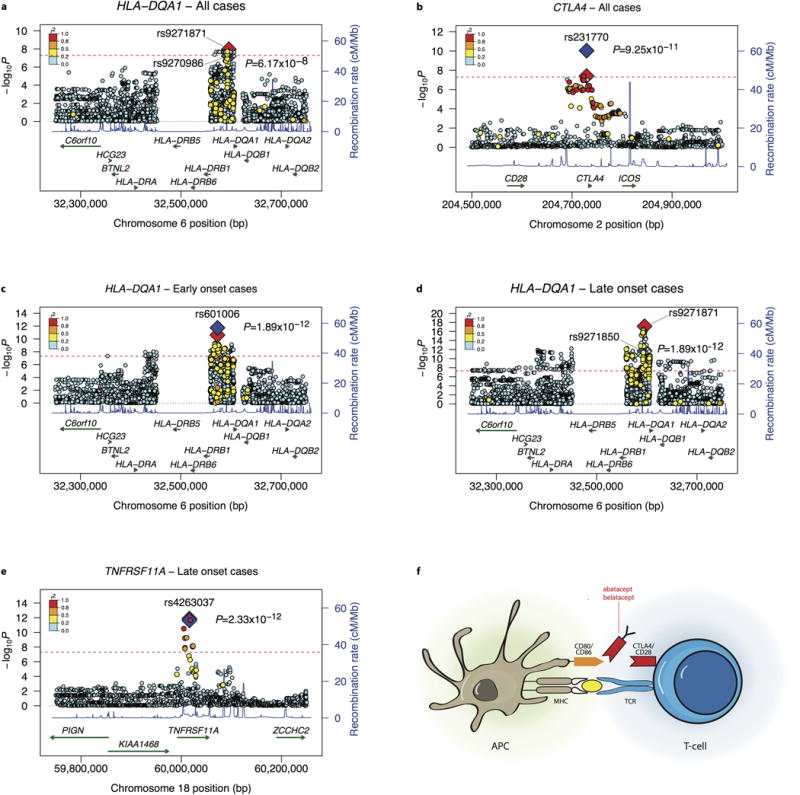
Regional association plots of the signals at the major histocompatibility complex (MHC) region (A) and CTLA4 (B) in all myasthenia gravis cases (972 cases and 1977 control individuals), as well as the MHC region in early-onset myasthenia gravis cases (C; 235 cases and 1977 control individuals), the MHC region in late-onset cases (D), and TNFRSF11A in late-onset myasthenia gravis cases (E; 737 cases and 1977 control individuals). Single-nucleotide polymorphisms are colored on the basis of their linkage disequilibrium with the labeled hit single-nucleotide polymorphism. Recombination rates estimated from the CEU HapMap population are represented by the blue line and genes are marked as arrows. Red diamonds represent the most associated single-nucleotide polymorphism in the discovery cohort and blue diamonds, P values for the combined discovery and replication cohorts. F, CTLA4 regulates T-cell activation by antigen-presenting cells (APCs). TCR indicates T-cell receptor.