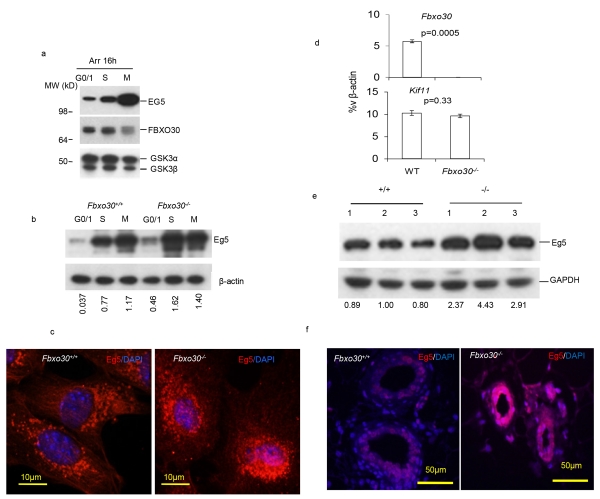
Fig. 5.
FBXO30 regulate EG5 oscillation during cell cycle. a. Increased EG5 protein levels at mitosis correlates with reduced Fbxo30. HCT116 cells with Fbxo30-3×-Flag knock-in alleles were arrested at G0/1 phase with serum-free medium, early S phase with 1 μg/ml aphidicolin, or M phase with 50 ng/ml nocodazole. All treatments were performed for 16 hours. The lysates were analyzed for the endogenous levels of EG5 and Fbxo30 by Western blot. GSK3 levels were used as a loading control. Data shown have been reproduced 3 times. b. Fbxo30 deletion greatly increases Eg5 levels at S and M phase of the Fbxo30−/− MEFs. WT and Fbxo30−/− MEFs were arrested for 16 hours in serum-free media, 1 μg/ml aphidicolin, or 50 ng/ml nocodazole. The lysates were analyzed for the endogenous levels of EG5 by Western blot. β-actin levels were used as a loading control. The relative amounts of EG5 protein are provided underneath each lane. The numbers indicate the ratio of signals from anti-EG5 over anti-β–actin. Data shown have been reproduced 3 times. c. Elevated Eg5 levels in Fbxo30−/− MGEs. WT and Fbxo30−/− MGEs were arrested at S phase with 1 μg/ml aphidicolin for 16 hours. Images shown are representative of those obtained from three independent experiments. d. Normal expression of the Kif11(Eg5-encoding) gene in Fbxo30−/− mammary glands. RNA isolated from single cell suspension of WT and Fbxo30−/− mammary glands were analyzed for expression of Fbxo30 and Kif11. While deletion of Fbxo30 abolished expression of Fbxo30, it had no effect on the Kif11 transcript, as determined by real-time PCR. e. Western blot data using lysates MGE (n=3). The images of the Western blot were shown in the top panel. The relative amounts of Eg5 protein are provided underneath each lane. The numbers indicate the ratio of signals from anti-Eg5 over anti-Gapdh. These data have been reproduced twice. f. Eg5 staining in WT and Fbxo30−/− mammary as determined by immunofluorescence. The nuclei are visualized by the DNA dye DAPI. Data shown are representative images from 3 experiments, each involving 1 fatpad from 1 mouse per group.

