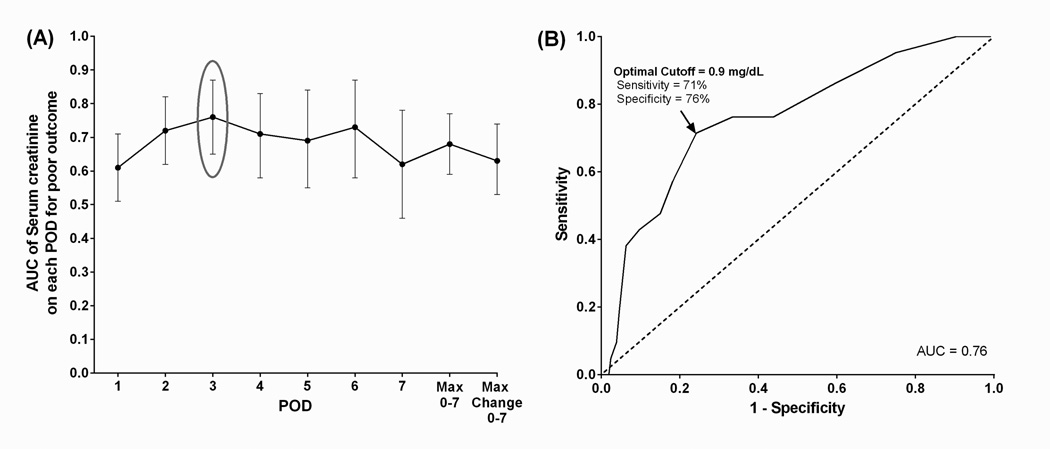
Figure 3. Serum creatinine and poor composite outcome by post-operative day.
(A) Area under the curve for each of the first seven PODs were compared to determine the most predictive time point for poor outcome. (B) The optimal cutoffs of SCr on the selected POD for predicting poor outcome from (A) were then determined based on sensitivity and specificity from the ROC curve.

