
Figure 3.
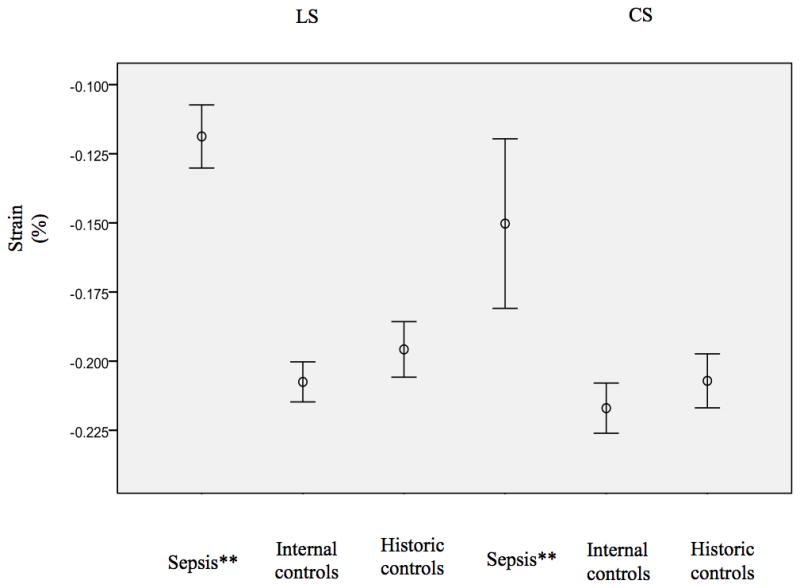
This figure demonstrates the peak systolic longitudinal (left) circumferential (right) strain for the 23 patients with sepsis as compared to the internal and age matched historic controls (average and standard error of the mean). Significant depression seen in the septic group (**)