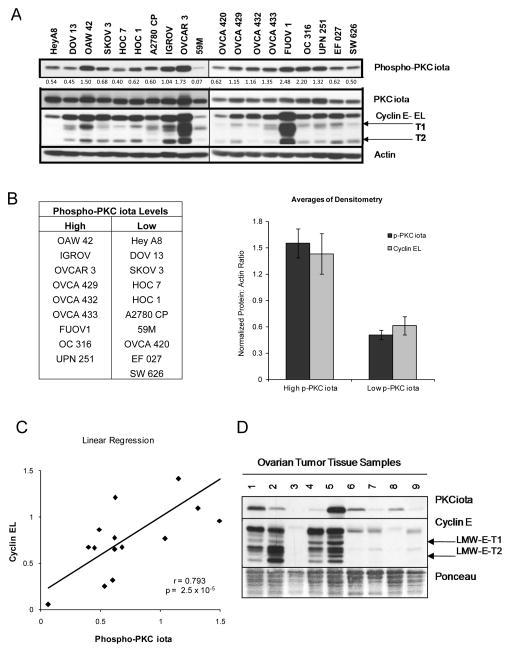
Figure 1. Phospho-PKCiota and Cyclin E expression are positively correlated in ovarian cancer cell lines.
(A) Nineteen ovarian cancer cell lines of differing histological subtypes were subjected to western blot analysis with antibodies against Phospho-PKCiota, PKCiota, Cyclin E. Actin was used as a loading control. Relative levels of phospho-PKCi was determined by denistometric analysis and values (as a function of actin) are indicated below the western blot. (B) Phospho-PKCiota was used as the functional, activated form of PKCiota protein to separate the 19 cells into high and low phospho-PKCiota expressing cells with the cut off of 1.0 (from densitometry values) (Table). Relative levels of full length cyclin E (also determined by densitometric analysis of western blots) was next used to plot the mean phospho-PKCiota and cyclin EL levels (Bar graph). (C) Linear regression of Cyclin EL values as a function of phospho-PKCiota were plotted (r = 0.79; p = 2.5 × 10⁻⁵). (D) Ovarian cancer patient samples were analyzed by Western blot analysis with PKCiota and cyclin E [full-length (EL), LMW-E-T1 and LMW-E-T2] antibodies. Ponceau stain was used as a loading control.

