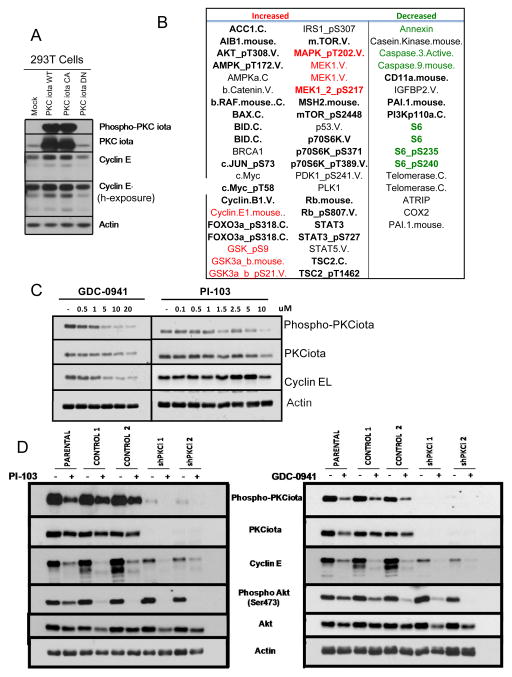
Figure 7. RPPA Analysis of 293T Cells with PKCiota Overexpression.
(A) 293T cells were transiently transfected with wildtype (Wt), constitutively active (CA), or dominant negative (DN) PKCiota were subjected to (A) Western blot analysis with the indicated antibodies and RPPA analysis. (B) List of proteins whose expression levels either increased or decreased in the 293T-PKCiota Wt and CA samples but not the control or PKCiota DN samples. Bold letters indicate proteins with greatest correlation. (C) IGROV parentl cells were treated PI3K inhibitors, GDC-0941 and PI-103, at increasing concentrations. Western blot analysis was used to examine changes in phospho-PKCiot, PKCiota and cyclin E levels. Actin was used as a loading control (D) IGROV parental, shControl (two independent clones) and ShPKCiota (two independent clones) were treated with 5 μM GDC-0941 and 1.5 μM PI-103 for 24 hours and subjected to western blot analysis with the indicated antibodies. Each experiment was performed in triplicate.

