Figure 1.
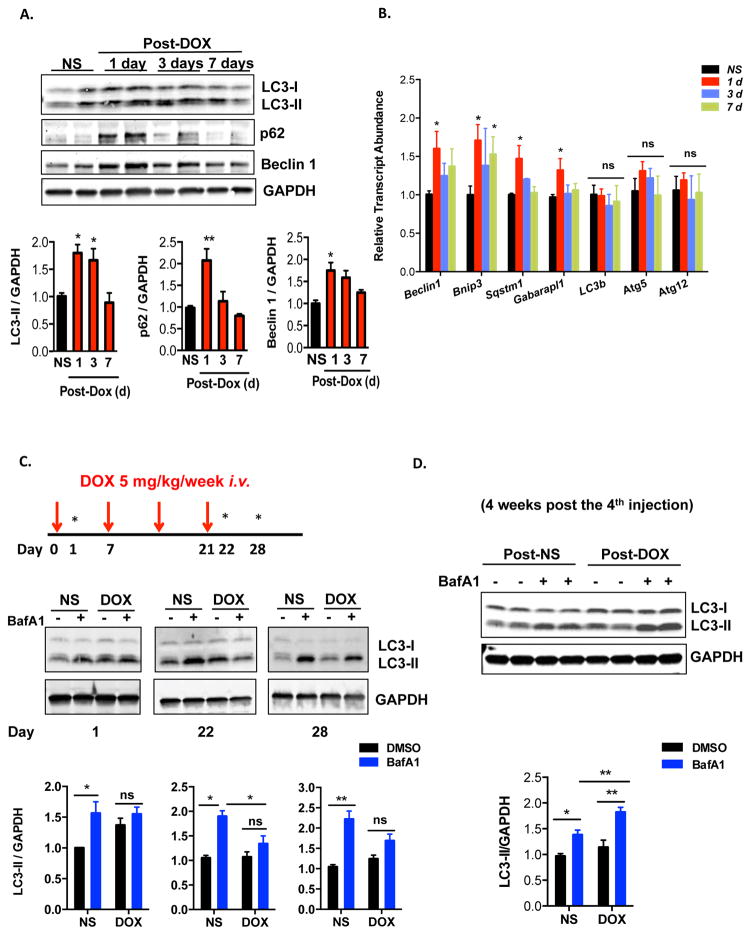
Doxorubicin inhibits autophagic flux in mouse heart. (A) Temporal changes in LC3-II, p62 and Beclin 1 protein levels after one dose of doxorubicin. Hearts were harvested at different time points after IV injection of doxorubicin (5 mg/kg, DOX) or normal saline (NS). Immunoblotting of LC3, p62 and Beclin 1 in heart lysates and quantifications are shown. N = 3–5 mice per group. One-way ANOVA analysis followed by Tukey post hoc test was used to compare doxorubicin-treated animals with control animals. (B) Transcript abundance of multiple autophagy-related genes (including p62/Sqstm1) at different time points after doxorubicin treatment. N = 3–6 mice per group. One-way ANOVA analysis followed by Tukey post hoc test was used to compare doxorubicin-treated mice with control mice. (C) Doxorubicin inhibited cardiac autophagic flux. Bafilomycin A1 (1.5 mg/kg, BafA1) was administered 22 hours after one dose of doxorubicin (5 mg/kg) to assess acute autophagic changes, as well as 22 hours and 7 days after 4 serial doxorubicin injections to assess autophagic changes in a chronic doxorubicin model. Immunoblotting of LC3 is shown. N = 4–5 per group. Asterisks on the schematics point to time points of assessment of autophagic flux. Two-way ANOVA analysis followed by Tukey post hoc test was used to compare multiple groups. (D) Autophagic flux was increased in mouse hearts 4 weeks after the fourth injection of DOX. N = 6 per group. Two-way ANOVA analysis followed by Tukey post hoc test was used to compare multiple groups. *, p < 0.05; **, p < 0.01; ns, not significant.

