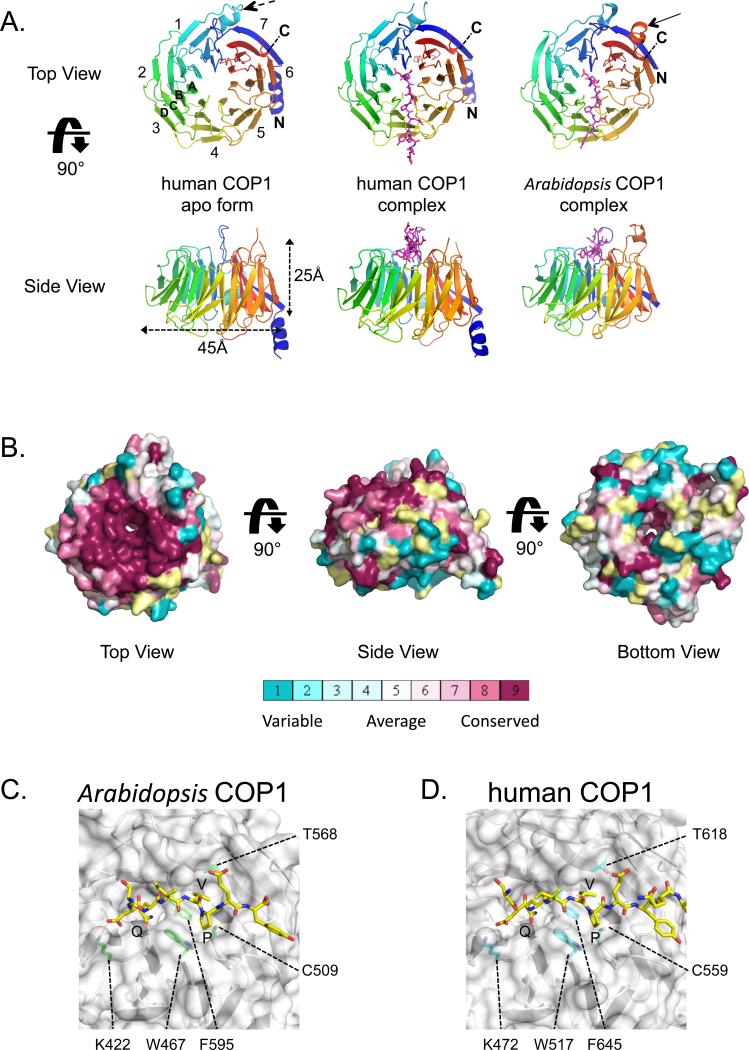
Figure 2. Structures of human and Arabidopsis COP1 WD40 domains.
A. Cartoon representation. Top and side views are shown for unbound human COP1 (left), the human COP1-peptide complex (middle) and the plant COP1-peptide complex (right). The Trib peptide is shown in magenta as sticks. Numbers denote blades from N- to C-terminus (colored on a rainbow scale from blue to red), and letters A-D indicate strands of a typical blade. A dashed arrow in the top view of human COP1 points to the helical insert between strands 1C and 1D. A second arrow in the top view of the plant COP1 indicates the 6D to 7A loop. B. Surface representation, colored according to sequence conservation on a sliding scale from maroon (highest) to cyan (lowest) using the program Consurf (Ashkenazy et al., 2010). C, D. Closeup views of the Arabidopsis COP1 (C) and human COP1 (D) complexes. The protein backbones are shown as cartoons and the surface is in white, with key interface side chains labeled and rendered as sticks. The Trib peptide is shown in yellow and residue sidechains are represented as sticks.

