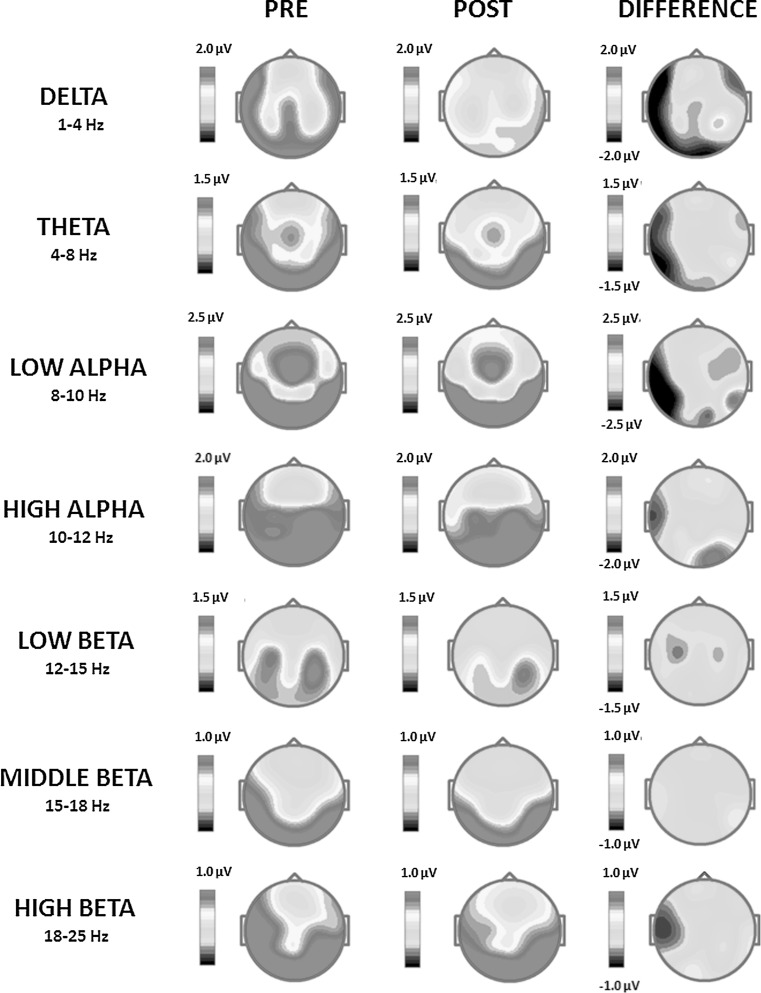
Fig. 6.
Pre and post-SCP training two-dimensional (2D) maps of the absolute power distribution for subsequent frequency bands: delta (1–4 Hz), theta (4–8 Hz), low alpha (8–10 Hz), high alpha (10–12 Hz), low beta (12–15 Hz), middle beta (15–18 Hz) and high beta (18–25 Hz) were computed from the EEG signal recorded in the eyes-closed condition. The differential absolute spectra for each frequency band are also provided. The maps were calculated by subtracting absolute amplitude spectra of the signal recorded after the SCP Neurofeedback therapy from the spectra of the signal acquired in the same condition before the therapy (Color figure online)

