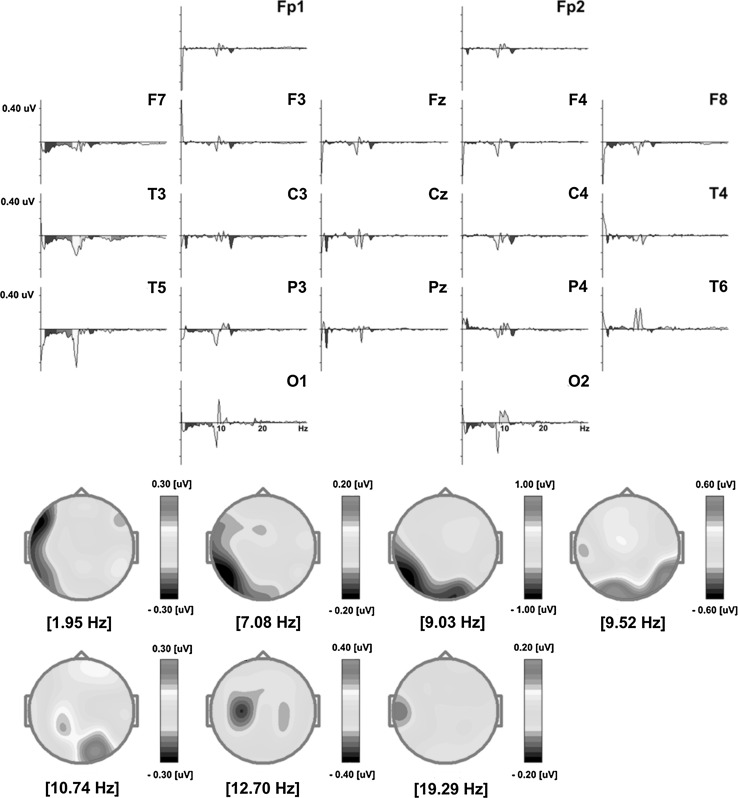
Fig. 7.
The upper part of the figure shows differential absolute amplitude spectra of EEG signals recorded in the eyes-closed condition calculated separately for each electrode. Particular spectra were computed by subtracting the amplitude spectra of the signal recorded after SCP Neurofeedback training from the amplitude spectra of the signal recorded before the therapy. The lower part of the figure presents maps of distribution of frequencies which were most significantly altered after the training (Color figure online)

