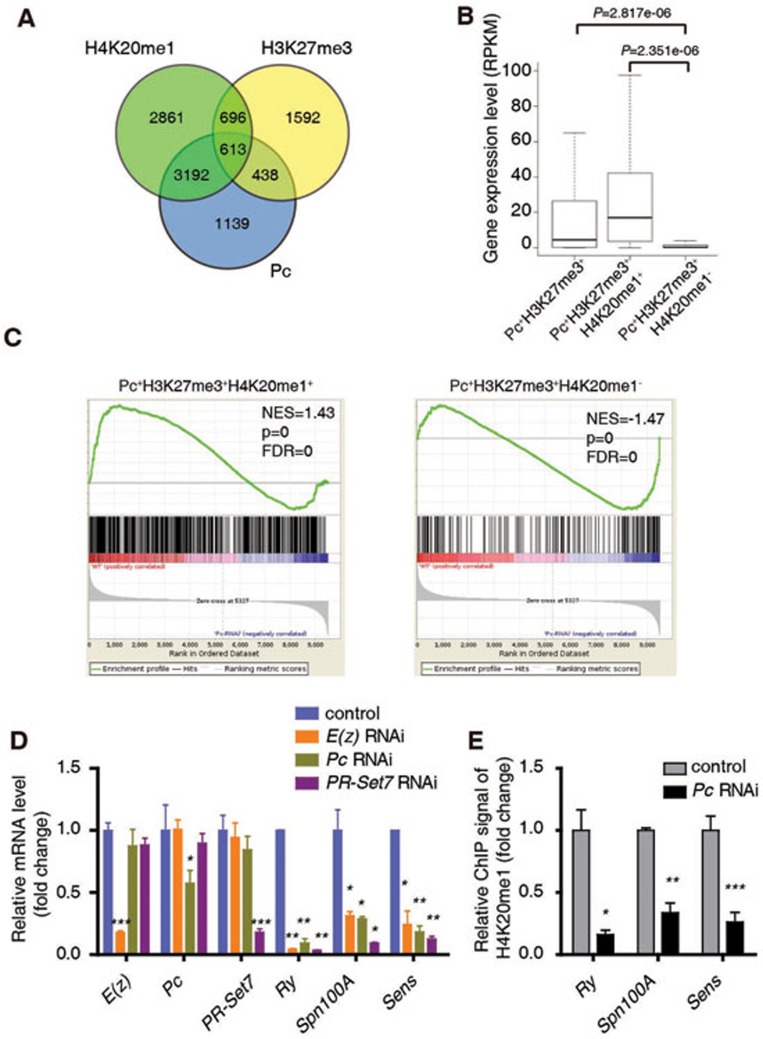
Figure 4.
H3K27me3, Pc and H4K20me1 function together to positively regulate common genes encoding developmental regulators. (A) A Venn diagram showing the overlap among target genes of Pc, H4K20me1 and H3K27me3 in WT 3rd instar larvae wing disc. (B) Expression analysis of all the Pc/H3K27me3 target genes (1 051 genes, Pc+H3K27me3+), and two subsets of these genes (438 genes without H4K20me1 named as Pc+H3K27me3+H4K20me1−, 613 genes with H4K20me1 named as Pc+H3K27me3+H4K20me1+). The RPKM values are based on RNA-seq data with 3rd instar larvae wing discs. (C) GSEA shows that Pc+H3K27me3+H4K20me1+ genes tend to be positively regulated by Pc while Pc+H3K27me3+H4K20me1− genes tend to be repressed by Pc in the wing disc. (D) RT-qPCR analysis of mRNA levels of E(z), Pc, PR-Set7, Ry, Spn100A and Sens in Act5c-Gal4 or Act5c-Gal4/uas-dsRNA E(z)/Pc/PR-Set7 wing disc. (E) A ChIP-qPCR analysis using anti-H4K20me1 antibody with control or Pc RNAi wing discs at Ry, Spn100A and Sens loci. ChIP signal levels are represented as percentages of input chromatin. The signal levels in control wing discs are defined as 1, and the fold change is shown. Means ± SD; n = 3. *P < 0.05, **P < 0.01, ***P < 0.001. Unpaired, two-tailed Student's t-test. See also Supplementary information, Figure S4.

