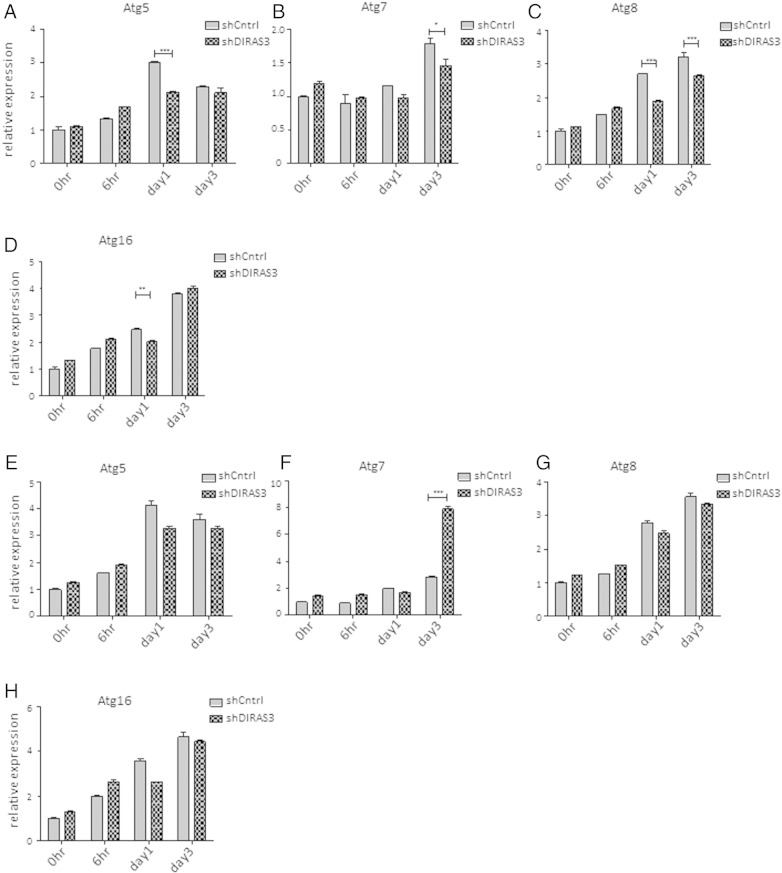
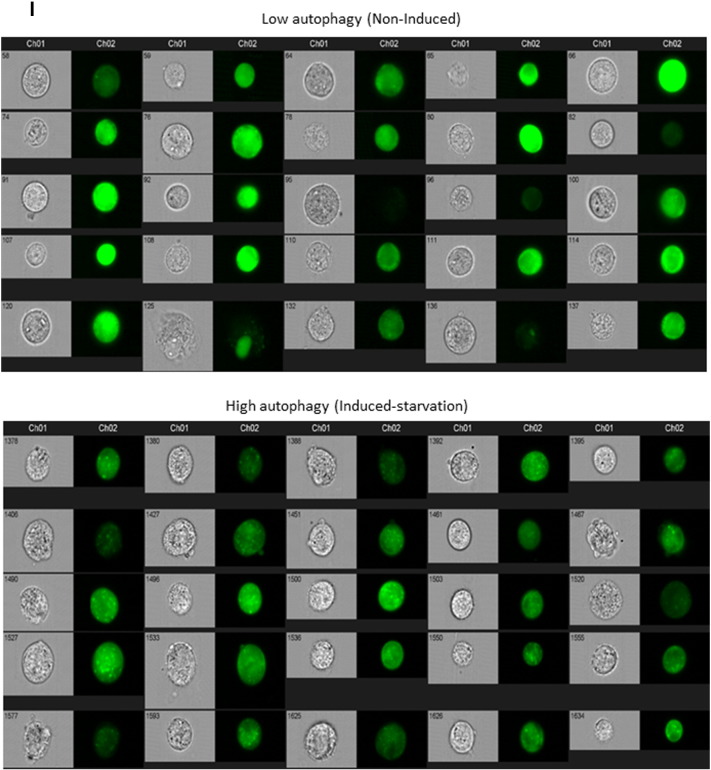
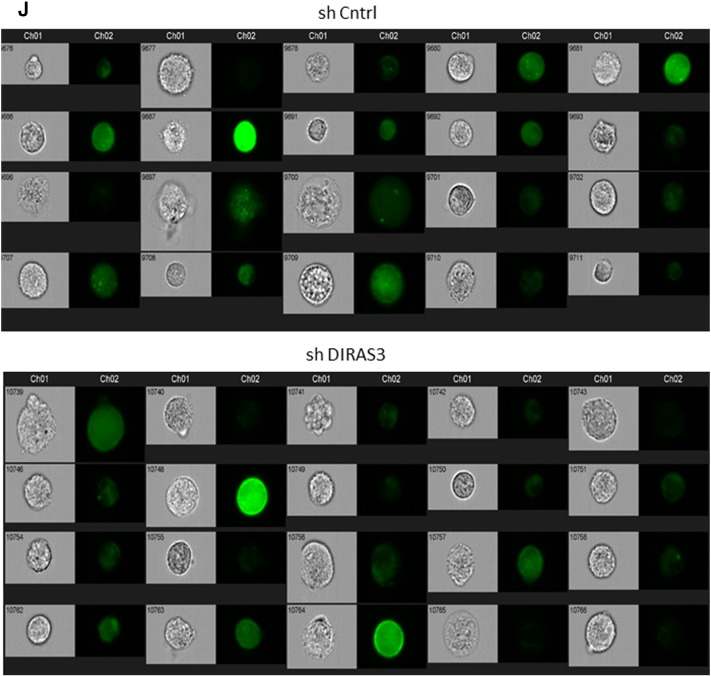
Supplementary Fig. 6.
Expression of autophagy related genes during adipogenesis in human ASCs and after knockdown or overexpression of DIRAS3. (A–D) Expression of Atg5 (A), Atg7 (B), Atg8 (C) and Atg16 (D) was analyzed by q-RT-PCR during adipogenesis, comparing shCntrl and shDIRAS3 expressing lentiviruses infected ASCs. (E–H) Q-RT-PCR was employed to monitor the expression of Atg5 (E), Atg7 (F), Atg8 (G) and Atg16 (H) during adipogenesis, comparing Mock and DIRAS3 over-expressing lentiviruses infected ASCs. All genes were normalized to actin. (I) ASCs were co-infected with GFP-LC3 lentiviruses. Serum starved cells were taken as a positive control for autophagy induction and non-serum starved cells were used as negative control. Cells were analyzed by image stream multispectral flow cytometer. Representative low autophagic (upper panel) and high autophagic cells (lower panel) are shown. (J) ASCs were co-infected with GFP-LC3 and shControl (shCntrl) or shDIRAS3 lentiviruses. Cells were analyzed by image stream multispectral flow cytometer. (J) Representative shCntrl (upper panel) and shDIRAS3 (lower panel) cells are shown. All error bars represent the means ± SEM. p values * = p < 0.05, ** = p < 0.001 and *** = p < .0001. The significance of difference between means was assessed by analysis of variance (ANOVA) (A–H).


