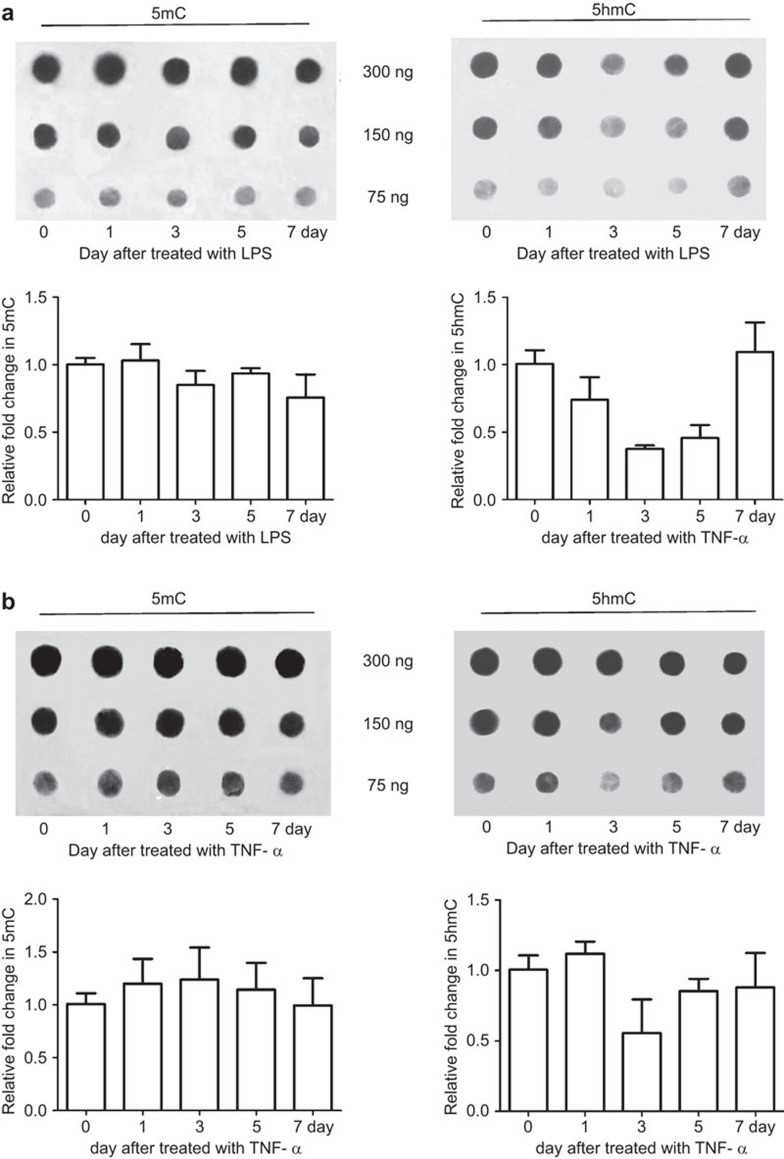
Figure 6.
DNA methylation/hydroxymethylation in AD-MSCs treated with LPS/TNF-α. Dot blot analysis for 5hmC/5mC on days 1, 3, 5 and 7 after LPS or TNF-α treatment. The values are presented as the means±s.d. AD-MSC, adipose tissue mesenchymal stem/stromal cell; 5hmC, 5-hydroxymethylcytosine; 5mC, 5-methylcytosine; LPS, lipopolysaccharide; TNF, tumor necrosis factor.

