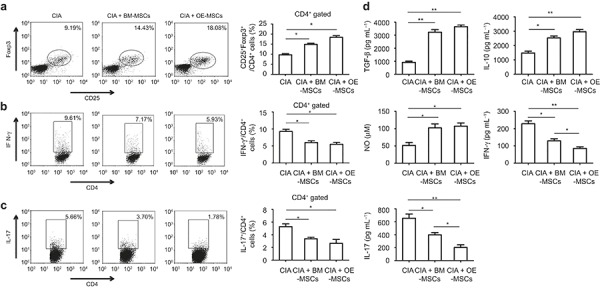
Figure 4.

OE-MSCs enhanced Treg cell levels during CIA. (a–c). Flow cytometric analysis of CD4+ Foxp3 +CD25+ Treg cells (a), CD4+ IFN-γ+ Th1 (b) and CD4+ IL-17A+ Th17 (c) in the dLN of CIA mice that were treated with OE-MSCs, BM-MSCs, or PBS. (d) Serum TGF-β, IL-10, NO, IFN-γ, and IL-17 levels in CIA mice that were treated with OE-MSCs, BM-MSCs, or PBS were detected with ELISAs (n = 3/group). Results are expressed as the mean ± SD. **P < 0.01,*P < 0.05.
