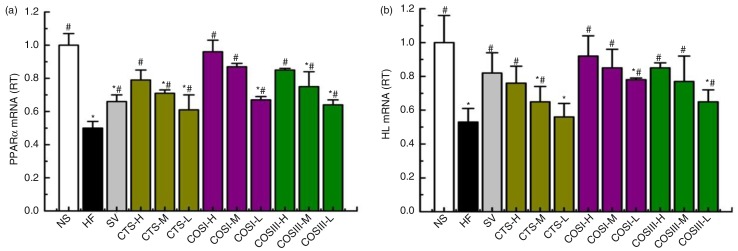
Fig. 10.
The mRNA expression levels of liver PPARα (a) and HL (b) in the different group. The level of mRNA was detected by Q-PCR. ΔCt is the average value of 10 samples in the formulation (average mRNA expression of experiment groups/average mRNA expression of NF groups) = 2−ΔΔCt=2(−ΔCt control −ΔCt FF). If 2−ΔΔCt<1, the average mRNA expression of the experiment groups is lower than that in the NF group. If this value is higher than 1, the average mRNA expression of the experiment groups is higher than that in the NF group.

