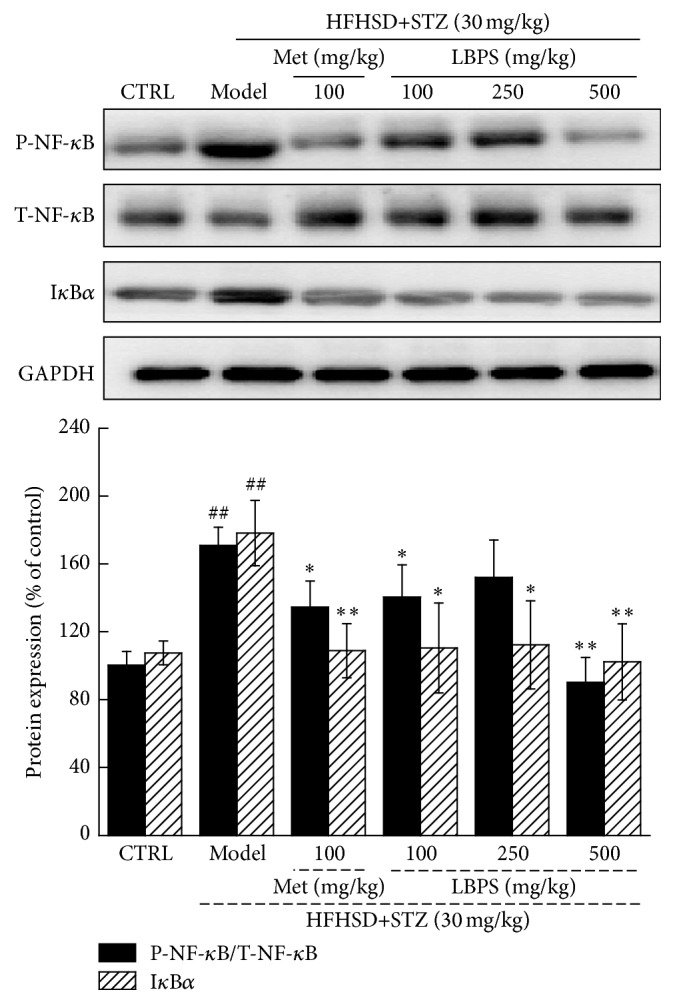
Figure 6.

After four-week Met and LBPS treatment, the expression of P-NF-κB, T-NF-κB, and IκBα in kidney was determined using western blot. Quantification data of the expressions of P-NF-κB and IκBα was normalized by T-NF-κB and GAPDH, respectively. Data are expressed as mean ± SD (n = 4) and analyzed by using a one-way ANOVA. ## P < 0.01 versus normal controls; ∗ P < 0.05 and ∗∗ P < 0.01 versus diabetic model rats.
